
Monday, October 4th, 2021
Happy Marvelous Monday!
I help teach people to earn money trading options. It isn’t hard. I explain in easy-to-understand terms when I teach or write a book—like we are talking across the kitchen table.
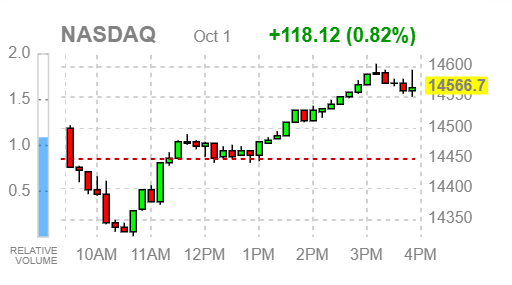
Monday continued it move into correction territory with both feet. The Nasdaq was down 4 out of 5 days, ending the week lower. Friday put on the brakes after touching the 55 EMA. The QQQs closed the week down 13.15 despite Friday’s 118 point climb.
For updates on previous trades, please scroll down.
I am going to focus on the NASDAQ on Mondays and call it “QQQ Monday”. I will focus on QQQ which is the ETF covering companies traded within the NASDAQ Exchange Traded Fund.
For today’s discussion, we will be looking at Invesco QQQ Trust, symbol (QQQ).
Before analyzing QQQ’s charts, let’s take a closer look at the ETF and its services.
Invesco QQQ is an exchange-traded fund that tracks the Nasdaq-100 Index™. The Index includes the 100 largest non-financial companies listed on the Nasdaq based on market cap. These companies are often cut-edge tech stocks and trendier companies.
The image below is Friday’s price activity.
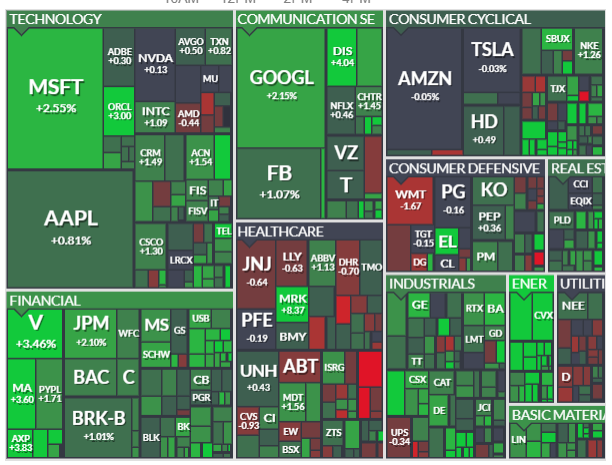
This chart image is courtesy of FINVIZ.com a free website and gives a quick view of each day’s movement.

This is an image from Friday where it dropped throughout most of the day. The carpet shows a lot of red. Many of the symbols with 4 or 5 letters are included in the QQQs- AAPL, AMZN, GOOGL, etc.
Fibonacci Exponential Moving Averages (EMA)
Exponential moving averages (EMAs) reduce the lag seen in simple moving averages by applying more weight to recent prices. The weighting applied to the most recent price depends on the number of periods in the moving average. We are applying 8, 21, and 55 weekly periods for our entry signals. EMAs differ from simple moving averages in that a given day’s EMA calculation depends on the EMA calculations for all the days prior to that day. You need far more than 10 days of data to calculate a reasonably accurate 10-day EMA.
There are three steps to calculating an exponential moving average (EMA). First, calculate the simple moving average for the initial EMA value. An exponential moving average (EMA) must start somewhere, so a simple moving average is used as the previous period’s EMA in the first calculation. Second, calculate the weighting multiplier. Third, calculate the exponential moving average for each day between the initial EMA value and today, using the price, the multiplier, and the previous period’s EMA value.
Charting services like Stockcharts.com and your broker’s chart service figure these calculations for you.
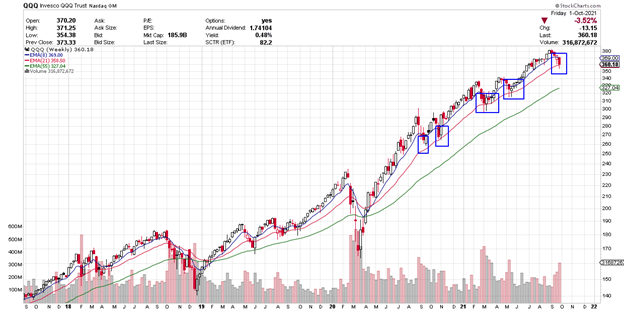
As mentioned, entry signals are based on the use of 8, 21, and 55 weekly averages. (8, 21 and 55 are Fibonacci numbers which are a special sequence of numbers which are added together- 1+1= 2, 2+1=3, 2+3=5, 5+3= 8, etc. 13, 21, 34, 55, 89, 144, 233, 377, 600… As mentioned, we are zeroing in on 8 EMA (short term), 21 EMA (medium term) and 55 EMA (long term).
The details below show why this trade signal could produce a profitable trade opportunity.
Let’s See Why This Signal Potentially Offers Potential Trade Info
Each candle on the chart represents price movement over a 5-day (week) period. QQQ is apt to continue dropping if the EMAs head lower toward down-trending order. In March and May this year, price pulled back toward the 21 EMA and then, bounced up off that area. The last 4 weeks price has been heading down, as seen above, the end result is price dropping and then this week we dropped to touch the 21 EMA. The chart is annotated to show the 5 times it touched this area and then soon used it to bounce up like a trampoline. As seen, it has happened numerous times, but there is no guarantee it will happen again. We will have to wait and see how the week plays out.
As long as the 8 EMA remains above the 21 EMA and the 8 and 21 EMA both remain above the 55 EMA, said to be in uptrending order, its current uptrend could remain intact, and price could continue to rise again. Since the last four red candles are strong bearish ones, it creates an uncertain environment. If this week heads up, it will perhaps have had a substantial pullback/correction but we won’t know until we have the start an upward week. If it were to drop and have a weekly candle close below the 21EMA, that would be a breech that hasn’t happened since March 2020 and the start of Covid. We will keep an eye on QQQ’s movement over the course of the couple weeks.
Because of the uncertainty, I suggest we pause and observe for another week. That is the safest path to take, that said, if the week starts on a bullish note, I will post a potential trade. At this point, it is impossible to know how the market will open on Monday. Futures are up as I type. The overall bias is down, but the last candle says it is trying to recover. It is a push – pulled tug-a-war.
I will list a potential bullish trade because of the possibility of this level holding again as it has in the past. If Monday is bearish (negative price move), don’t consider a bullish trade.
Potential Profit Play for QQQ
Last week, I expected a down week, and that is how it ended. Now price is at a past support level of the 21 EMA. Will it hold? If it does, a Call trade could be considered if price begins to rise above 360.
If you purchased 2 shares of the QQQs at 360, this would be an investment of 740. If price rose to 370, this is a profit of $10 per share or $20 or 2.7 profit.
If Monday is a bullish day, you could consider buying the October 18th expiration (Oct 21) and a 370 strike with a premium of 1.81. If price rises to 370, this $10 gain would likely increase premium by $7, rising to $8.81 or $700 profit on the contract or a gain of 377%. This would be an awesome trade.
Options often offer a smaller overall investment, covering more shares of stock and potential for greater profits, as well as making money when the price of a stock drops.
Remember, you can take profit anywhere along the line, you don’t have to wait for the expiration date to sell. It is often wise to take profit when it is earned, especially in a volatile market.
If price drops below the support line, it can be wise to sell to reduce loss. As the expiration date nears, the premium will lose an increasing time value.
EMAs and line crosses are at the heart of most of my strategies. Many strategies come with a weekly newsletter listing numerous potential trade candidates.
I love teaching and sharing. It is my “thing”.
Wendy Kirkland
PS-I have created this daily letter to help you see the great potential you can realize by trading options. Being able to recognize these set ups are a key first step in generating wealth with options. Once you are in a trade, there is a huge range of tools that can be used to manage the many possibilities that can present themselves. If you are interested in learning how to apply these tools and increase the potential of each trade click here.


Recent Comments