
Dear Reader,
This morning, I was scanning the market and came across this great looking stock chart, did you happen to catch it too? If not, don’t worry, I have a full breakdown below.
The trade I spotted earlier is for Nasdaq, Inc. symbol: (NDAQ).
What made NDAQ stock standout is what I noticed in its stock chart. After pulling up NDAQ’s chart I noticed that the stock is signaling a powerful ‘Buy’ signal!
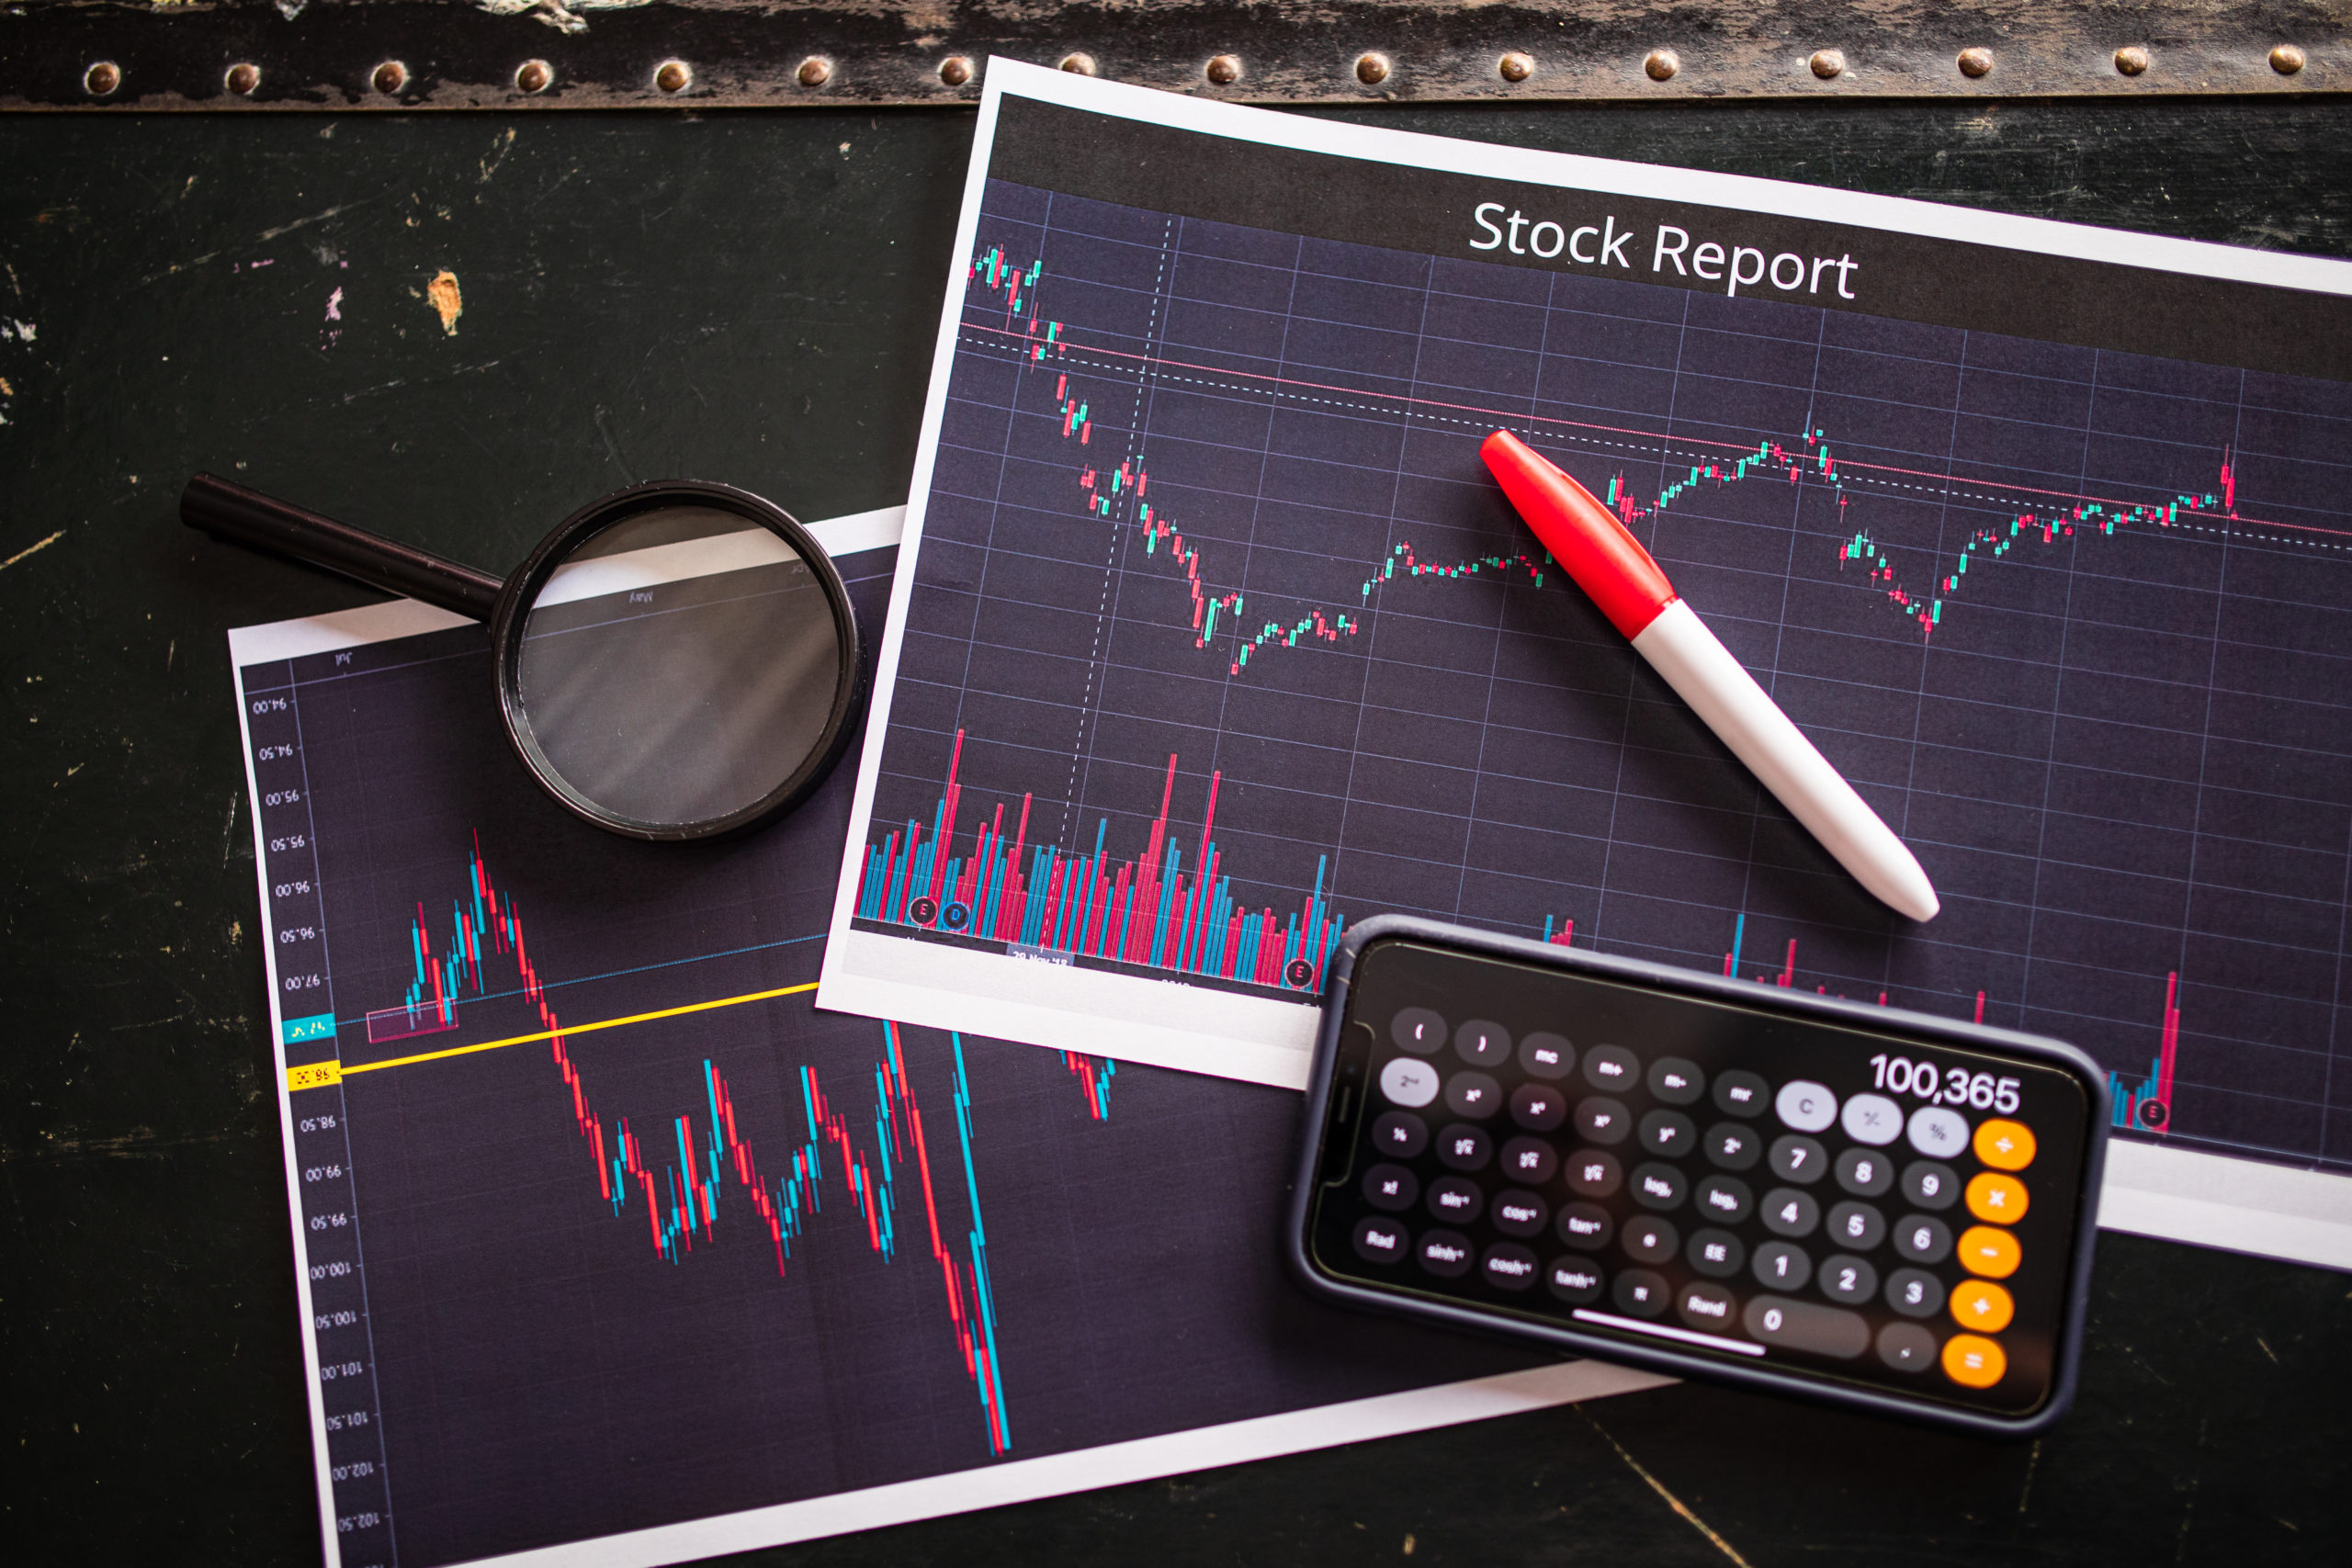
Below is a snapshot of NDAQ’s current stock chart. Let’s dive in so I can show you what made me stop scrolling when I saw this chart.

When I looked at this chart, I saw that back in November ‘23, NDAQ shares experienced a bullish breakout to the upside which generated a brand new technical signal for the stock.
In November ’23, NDAQ’s 1-Month Price finished the month trading above the 10-Month SMA and following my PowerTrend system, this qualifies as a ‘Buy’ signal for the stock.
Now, you may ask yourself, “Well the buy signal occurred in November of last year, have I missed the chance to trade this?” Don’t worry because we still have an opportunity to take advantage of this stock’s move, and I’ll tell you why.
This crossover indicated the buying pressure for NDAQ stock exceeded the selling pressure. For this kind of crossover to occur, a stock has to be in a strong bullish uptrend and as you can see, the 1-Month Price is still above the 10-Month SMA. That means the bullish trend is still in play!
When stocks break out to the upside like this, the bullish trend can often last longer than one might think.
How I Would Look to Trade It
Since NDAQ’s 1-Month Price is still trading above the 10-Month SMA signaling the PowerTrend ‘Buy’, this is offering an attractive trading setup.
I want to look to trade NDAQ’s trend and have the opportunity to capture some profits by placing an options trade on the stock.
Below is a Call Option Debit spread for NDAQ that I found just this morning that would allow me to gain some exposure to the stock’s powerful bullish trend but also have some downside protection built in as well. Let me tell you how this works.
Once I place a Call Option Debit spread, it has the ability to profit if the underlying stock/ETF is either up, flat, or even down a bit at option expiration.
Below is a snapshot of my Call Option Debit Spread Calculator that shows the profit potential and downside protection analysis for my trade. This example examines a range of a 7.5% increase to a 7.5% decrease in NDAQ share price at option expiration.

 Harness the Power of Optioneering Calculators
As a Wealth Creation Alliance member, you’ll have unlimited access to our suite of six powerful Optioneering Calculators. These cutting-edge tools allow you to calculate the profit potential of any option trade before you make your move, showing the potential in the position !
Looking at the trade analysis, the calculator shows that this one single trade, that would cost you only $270 to enter, has the ability to profit 85.2%.
The calculator reveals that if NDAQ, at option expiration, were to increase, remain flat, or even drop by as much as 7.5%, this low-cost trade would be set up to make an 85.2% return!
This Call Option Debit Spread strategy has been one of my absolute favorites to trade over the years and remains so today. The key behind it all is that by enabling your ability to profit if a stock is up, flat, or even down a bit gives you a much higher probability that your trade will end up a winner.
The Hughes Optioneering Team is here to help you identify high-probability trades just like this one.
Chuck’s A.I. Pattern Trader
Let me guess, like myself, you have probably heard non-stop about A.I. or Artificial Intelligence over the past year. It has just simply dominated the headlines!
Ever since I learned about the incredible capabilities of this technology, I have wanted to develop a way to harness this and apply it to my trading strategies.
Well over the past few months, my team and I have finally ‘cracked the code’ as we developed my brand new A.I. Pattern Trader! This is an A.I.-powered trade detection tool that is tuned in to find High Accuracy trade setups!
If you haven’t seen my presentation where I was finally able to unveil my new A.I. Pattern Trader, don’t wait! Click Here, to make sure YOU can witness the power of this tool!
Wishing You the Best in Investing Success,

Chuck Hughes
Editor, Trade of the Day
Have any questions? Email us at dailytrade@chuckstod.com
*Trading incurs risk and some people lose money trading.


Recent Comments