
Happy Fabulous Friday!
I teach everyday people (like me) to trade options. I do my best to write in an understandable way as if we are talking over the kitchen table.
In fact, I am going to be sitting down in a webinar next Wednesday to walk through my top two trading approaches and taking questions. If you want to get a detailed explanation of how these programs changed my life and did the same for many others, you can grab your spot here.
Bullish uptrend continues. The Dow has been up all 3 days this week as we move into a favorable time of the year for the market. December is often a bullish month.
For today’s Trade of the Day, we will be looking at Chevron Corporation, Symbol (CVX).
Chevron Corporation, through its subsidiaries, engages in integrated energy, chemicals, and petroleum operations worldwide. The company operates in two segments, Upstream and Downstream. The Upstream segment is involved in the exploration, development, and production of crude oil and natural gas. The Downstream segment engages in refining crude oil into petroleum products.
The company was formerly known as ChevronTexaco Corporation and changed its name to Chevron Corporation in 2005. Chevron Corporation was founded in 1879 and is headquartered in San Ramon, California.
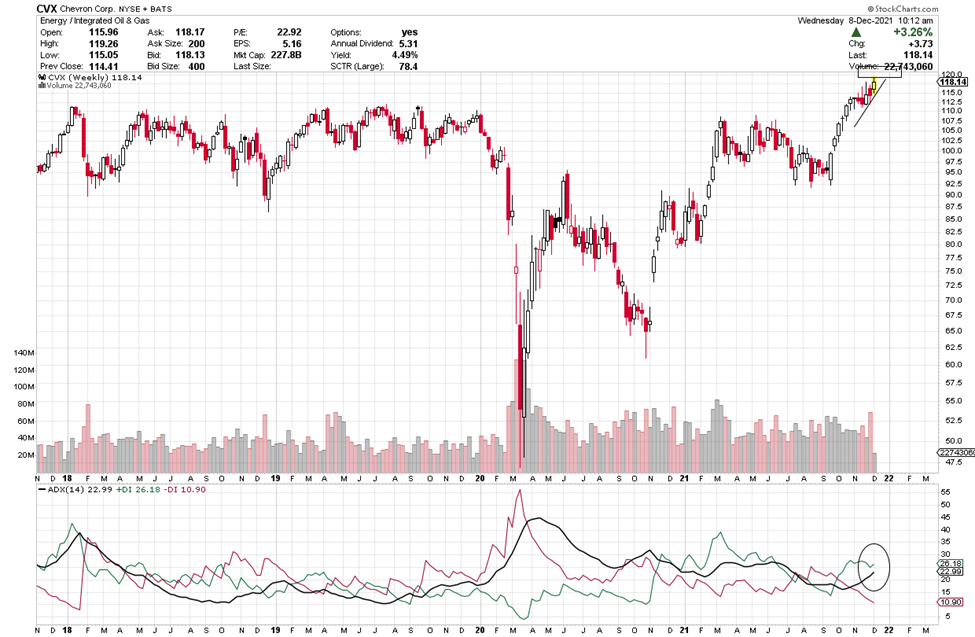
Let’s look at CVX’s weekly chart.
The ADX +DI (green line) is above the -DI and the ADX line is heading straight up. As long as the +DI is above the -DI, price should rise. Green above red is an indication of strength. When the +DI is bullish and the ADX turns up, it shows strength. If you want to learn more about ADX, read on or, if not, scroll down to the alert.

Average Direction Index (ADX) – Strength Indicator
The Average Directional Index consists of 3 lines: Green, Red and Black.
Green = +DI (Bullish)
Red = -DI (Bearish)
Black = ADX Strength Line
The DI line that is on top is in control. If the ADX line is heading up, strength is supporting the DI line that is on top and in control.
Check Out the Trade Alert Signal
Each candle on the chart represents price movement over a 5-day (week) period; therefore, it takes weeks for trades to play out. On the chart, the week is a bullish candle as I type. When the +DI crosses over the -DI line, it gives a buy signal (as the +DI line (green) appears as if it is in control and rising to head up on the ADX indicator, and as the ADX turns up that is even more bullish, suggesting an upward move is gaining strength. I’d like to see the green line to continue its upward bias and then the black line to turn straight up and head up as well. All are bullish signs of strength. When the +DI crosses the ADX (black line) and when it rises, it shows a new burst of strength coming into the equity.
The Black ADX line is a strength line and as it flips up and continues to head up, it shows strength, and we’ll know strength will continue to flow into this equity. We will keep an eye CVX the course of the next few weeks.
If CVX’s price moves above or stays above $120, you could consider a trade. The short-term price target for CVX is $125 and then, perhaps, higher. With the swings in past months, I am suggesting small profit targets until a market trend starts again.
CVX Potential Trade – Showing Strength
This signal could give a quick payout if it continues its upward move, and the strength of this pattern continues. It looks as if it could push above $125. I am typing on Tuesday and CVX started the day at $119 and is heading up, if it continues above 120 showing it is moving up, a trade could be considered.
To buy shares of CVX would cost approximately $120 per share and if it reaches its near-term target of $125 that would be a gain of $5 or 4%.
This is a great example of the benefits of trading options. Let’s discuss this as a study case.
Option trading offers the potential of a lower initial investment and higher percentage gain. Let’s take a look and make a comparison.
The plus DI (green line) is above the -DI and if it stays above the -DI (red) line and rises above $120 by Friday a call trade can be considered.
If you buy 3 shares at $120, you will invest $360. If the stock increases in price to $125, you will earn a profit of $5 per share or $15 for the 3 shares or about 4%.
If you bought one option contract covering 100 shares of CVX with an Dec 23 (Dec wk4) expiration date for the $120 strike and premium would be approximately $.33 today or $33 per 100 share contract. If price increased to the expected $125 target or a gain of $5 over the next few weeks, the premium would likely increase $2 to $2.33 ($2 x 100 share contract = $200 Profit.) $200 profit on your $33 investment, this is an 294% gain. Nice! Awesome trade if it hits it target!
Trading options is a win, win, win opportunity. Options often offer a smaller overall investment, covering more shares of stock and potential for greater profits.
I like to stress when trading options, you don’t need to wait for the expiration date to close the trade. You can close anywhere along the way prior to the expiration date. It is never a bad idea to take profit.
Trading options is like renting stocks for a fixed period of time. The potential to generate steady income with options is real and it can be transforming. Watch this video to learn how you can use option trading to achieve financial freedom. click here
Yours for a prosperous future,
Wendy Kirkland
Past Equity Candidates: Last week, we discussed TLT with an expiration of Dec 17th (Dec 21) and a 155 strike with a premium of .68. On Friday, price moved after open from 151.58 to 155.12. The premium went up to 1.90 or 179%. In sense, this would have been a one-day trade because this week on Monday, price started dropping.


Recent Comments