
In addition to spotting a gem buried in all of the market buzz, I am going to outline a great options approach that multiples the potential for trading success for a handful of folks in a live session this afternoon at 4:30 ET. If you want to catch it, just click here.
Which sector is the best sector to invest in right now?
That’s the eternal question for those of us managing active trading and investing portfolios. And right now, there are a lot of sectors that just don’t look that interesting.
I can see some interesting potential setting up with tech, as you can see here from the ETF QQQ:

QQQ has set up a possibly bull flag if it can trade above Tuesday’s high on Wednesday. It is rejecting prices below the 10-Day Moving Average. This all looks like the investment community is looking to buy the dip in this broad index. But that may not be the case until I see the follow-through today.

Semiconductors are a particularly attractive sub-sector of tech, seen here with the ETF SMH:

It’s a very similar setup but using the 20-Day Moving Average as support. And we know that when the market is bullish, everyone wants to talk about semiconductors.
But, for me, I’m still looking at the oil and energies sector, and I’ll show you why. First, let’s look at USO:

Oil prices are consolidating near the highs of the last week and allowing time to catch up a bit with price. The short-term upward trend has very little pullback and the potential for new highs looks good.
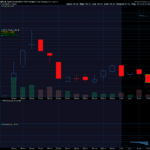
Moving on from oil flat price, I like looking at energy companies, starting with the ETF XLE:

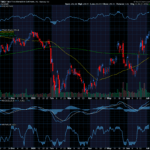
XLE has been in a bearish trend and seems to be showing support at the 200-Day Moving Average. The presence of that support gives a clear stop-loss level, which makes for a nice defined risk concept. And so, I can now look for an individual name that looks particularly interesting within the sector, and for me, that’s OXY:
OXY looks a lot like XLE in many ways but had less support from the 200-Day Moving Average. However, its recovery over the past week has pushed it through all key moving averages that I watch except for the 50-Day Moving Average. As it trades a few pennies below that line, I can justify entry here due to the crossing of any of my other key moving averages, or I can wait for the final pin to drop and go long above the 50-Day Moving Average. And with option prices at lows, this is a trade that I can greatly leverage thanks to low implied volatility! Adding OXY to my watchlist for a potential outright call option trade certainly looks like a good idea to me.
If you want to know more about options and how these technical signals can be leveraged in various underlying stocks, make sure you check out my Outlier Watch List, where I give a long list of stocks I’m considering for bullish and bearish entries via options.
And as always, please go to http://optionhotline.com to review how I traditionally apply technical signals, volatility analysis, and probability analysis to my options trades. And if you have any questions, never hesitate to reach out.
Keith Harwood
Keith@optionhotline.com


Recent Comments