
The market is showing signs of a bull trend. But within that bullish trend, it has still been a stock picker’s market.
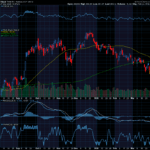
As I look at the overall market, there’s a clear sign of a bullish trend forming. The chart of the S&P 500 certainly looks like almost nothing can get in the way of continued upside:
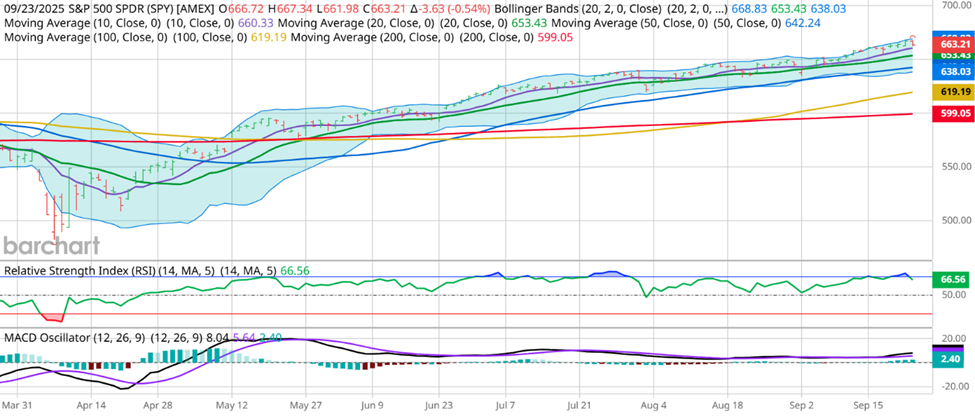
As the market continues to make new highs, it looks like making money should be getting easier and easier. In most major bull markets, buying almost anything traditionally works and makes traders feel like geniuses thanks to the tailwind of broad market investment. But when I dig a bit deeper, that’s simply not the case right now.

The number of stocks above their 50-Day Moving Average, which signals strength in the market participation, is maintaining an only lightly bullish setup through this market rally:
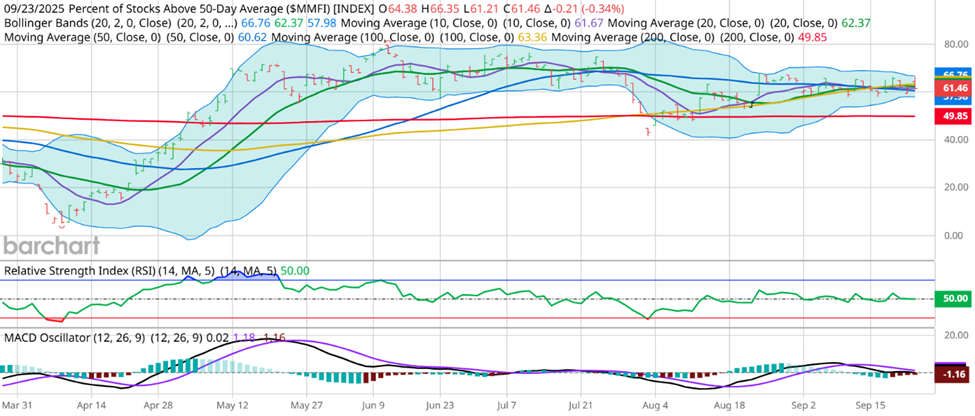
Using this MMFI Indicator, I can see that only about 60% of the stocks incorporated in the index are trading above their 50-Day Moving Average, while a number above 70% usually indicates broad market strength.
So, to truly find confidence in a bullish trade idea, I still need to do some digging to find which stocks have a bullish trend and furthermore, an indication of continuing that bullish trend.
And that’s why I continue to focus on the Forecast Toolbox in this market environment.
Sifting through hundreds of charts to find the right type of setup can be a major challenge, but having a tool that can help me filter to a smaller list of ideas is a major help.
Using the screening tools incorporated in the toolbox, I identified a setup that I really like right now in GE:
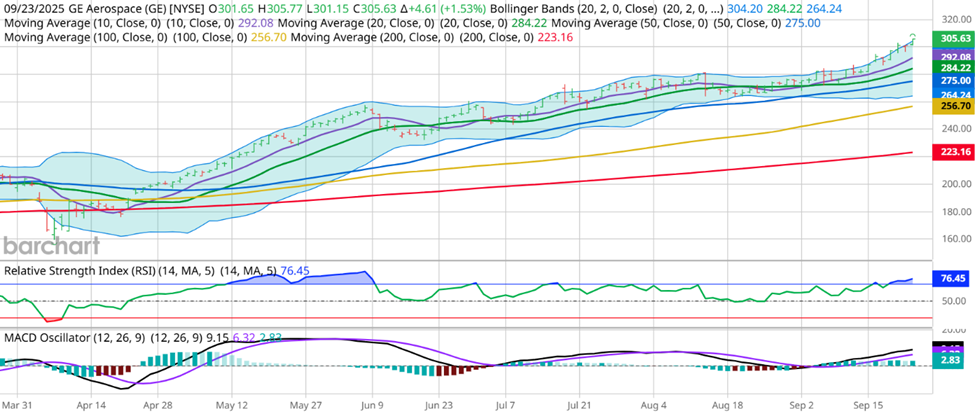
GE broke out, but that breakout doesn’t always mean continued money flow. That said, my confidence in this setup is certainly higher after seeing the Forecast Toolbox chart projection:
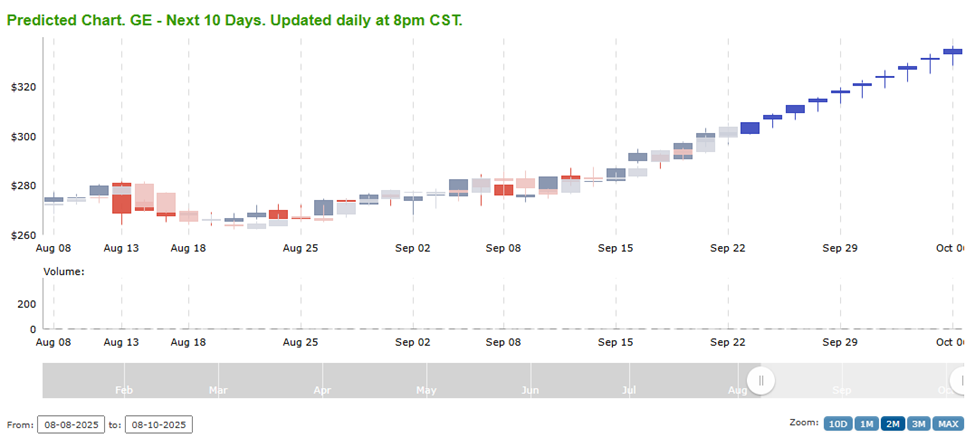
Further increasing my confidence, the Toolbox projected today’s close to be $305.52, and the actual close was $305.63. So far, so good. With projected upside to $335 in the next 2 weeks, this is another very exciting setup. The October 17h $310 Calls are trading for about $7.10 right now, and if the stock runs up to the AI-calculated target over the next two weeks, that option would be valued at $25 or more. With a number of stocks recently seeing large price movement to the upside recently, the pattern in GE is signaling a similar potential setup, and thanks to AI, I can have increased confidence that this pattern is the right setup for me.
If you’d like to get your hands on the Stock Forecast Toolbox and see what it can do for you, you can access a free trial HERE.
If you have any questions, never hesitate to reach out.
Keith Harwood
Keith@OptionHotline.com


Recent Comments