
Dear Reader,
Yesterday, we looked at a Daily Price Chart of Southern Co., noting that stock’s 50-Day EMA is trading above the 100-Day EMA signaling a ‘Buy’.
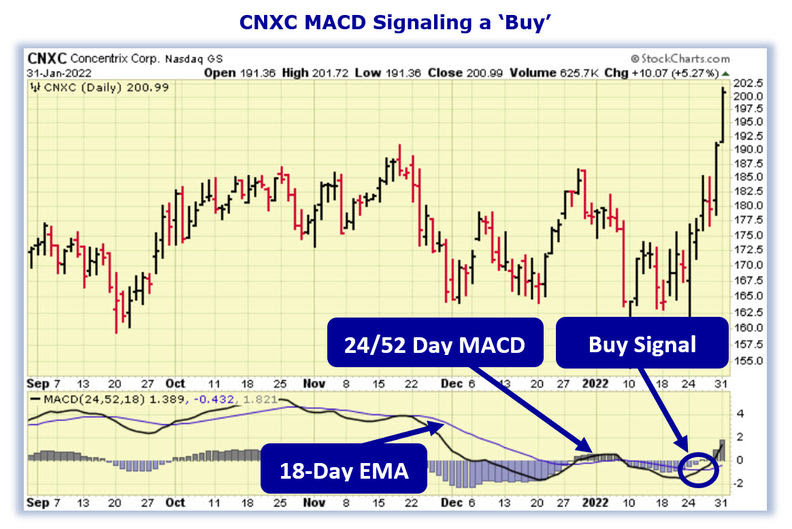
For today’s Trade of the Day e-letter we will be looking at a Moving Average Convergence/ Divergence (MACD) chart for Concentrix Corp. stock symbol: CNXC.
Before breaking down CNXC’s MACD chart let’s first review what products and services the company offers.
Concentrix Corporation provides technology-infused customer experience (CX) solutions worldwide. The company provides CX process optimization, technology innovation, front- and back-office automation, analytics, and business transformation services. It also offers customer lifecycle management; customer experience/user experience strategy and design; digital transformation; and voice of the customer and analytics solutions.
MACD Indicator confirms Price Momentum
The CNXC daily price chart below shows that CNXC is in a price uptrend as the 24/52 day MACD line (black line) is above the 18-Day EMA (purple line). The Moving Average Convergence/ Divergence chart is shown below the daily price chart.
MACD uses moving averages to create a momentum indicator by subtracting the longer-term moving average from the shorter-term moving average. The MACD is calculated by subtracting a stock’s longer term 52-Day Exponential Moving Average (EMA) from its shorter term 24-Day EMA. This creates the MACD line.
MACD ‘Buy’ Signal
The 18-Day EMA line functions as a buy/sell ‘trigger’. When the 24/52 Day MACD line crosses above the 18-Day EMA line it indicates positive momentum and higher prices for the stock. When the 24/52 Day MACD lines crosses below the 18-Day EMA it indicates negative momentum and lower prices for the stock. MACD is more of a leading indicator than a moving average cross over which tends to lag price movement.
MACD Histogram shows Acceleration of Momentum
Also included in a MACD chart is the histogram bar graph. This portion of the chart helps to illustrate the distance between the 24/52 Day MACD and the 18-Day EMA.
When a crossover initially occurs, the histogram’s bar will be near flat as the two indicator lines have converged. As the lines begin to separate, the bars grow in height, indicating a widening gap and acceleration for the stock’s momentum. When the histogram’s bars begin to shrink this indicates a narrowing of the gap between the 24/52 Day MACD and the 18-Day EMA and a slowing of the stock’s momentum. When the gap between the two indicators begins to narrow, this typically indicates a crossover of the indicator lines could happen soon.
Buy CNXC Stock
As long as the 24/52 Day MACD line remains above the 18-Day EMA, the stock is more likely to keep trading at new highs in the coming days and weeks.
Since CNXC’s bullish run is likely to continue, the stock should be purchased.
Our initial price target for CNXC stock is 211.00 per share.
Profit if CNXC is Up, Down or Flat
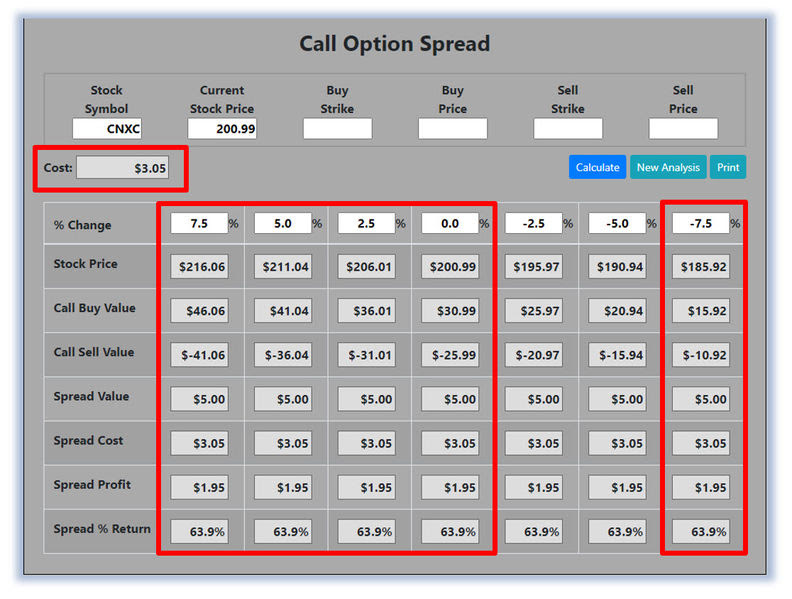
Now, since CNXC’s 24/52 Day MACD is trading above the 18-Day EMA and will likely rally from here, let’s use the Hughes Optioneering calculator to look at the potential returns for a CNXC call option spread.
The Call Option Spread Calculator will calculate the profit/loss potential for a call option spread based on the price change of the underlying stock/ETF at option expiration in this example from a 7.5% increase to a 7.5% decrease in CNXC stock at option expiration.
The goal of this example is to demonstrate the ‘built in’ profit potential for option spreads and the ability of spreads to profit if the underlying stock is up, down or flat at option expiration. Out of fairness to our paid option service subscribers we don’t list the option strike prices used in the profit/loss calculation.
The prices and returns represented below were calculated based on the current stock and option pricing for CNXC on 1/31/2022 before commissions.
Built in Profit Potential
For this option spread, the calculator analysis below reveals the cost of the spread is $305 (circled). The maximum risk for an option spread is the cost of the spread.
The analysis reveals that if CNXC stock is flat or up at all at expiration the spread will realize a 63.9% return (circled).
And if CNXC stock decreases 7.5% at option expiration, the option spread would make a 63.9% return (circled).
Due to option pricing characteristics, this option spread has a ‘built in’ 63.9% profit potential when the trade was initiated.
Option spread trades can result in a higher percentage of winning trades compared to a directional option trade if you can profit when the underlying stock/ETF is up, down or flat.
A higher percentage of winning trades can give you the discipline needed to become a successful trader.
The Hughes Optioneering Team is here to help you identify winning trades just like this one.
Interested in accessing the Optioneering Calculators? Join one of Chuck’s Trading Services for unlimited access! The Optioneering Team has option calculators for six different option strategies that allow you to calculate the profit potential for an option trade before you take the trade.
Trade High Priced Stocks for $350 With Less Risk
One of the big advantages to trading option spreads is that spreads allow you to trade high price stocks like Amazon, Google, or Netflix for as little as $350. With an option spread you can control 100 shares of Google for $350. If you were to purchase 100 shares of Google at current prices it would cost about $270,000. With the stock purchase you are risking $270,000 but with a Google option spread that costs $350 your maximum risk is $350 so your dollar risk is lower with option spreads compared to stock purchases.
Get Chuck’s Trades Sent to You!
Do you want to start receiving hand-picked trades from 10-Time Trading Champion, Chuck Hughes?
As a Trade of the Day subscriber, Chuck is offering you a special discount on his Weekly Option Alert Trading Service.
Just call Brad at 1-866-661-5664 or 1-310-647-5664 to join and use the code “Optioneering VIP” to receive special pricing!
Wishing You the Best in Investing Success,

Chuck Hughes
Editor, Trade of the Day
Have any questions? Email us at dailytrade@chuckstod.com
DISCLAIMER: The information provided by the Legacy Publishing LLC (“Legacy”) Trading Services, newsletters and educational publications (“Services”) is not customized or personalized to any particular risk profile or tolerance. Nor is the information published by Legacy a customized or personalized recommendation to buy, sell, hold, or invest in particular financial products. Past performance is not necessarily indicative of future results. Please note that results may not be typical and can vary from person to person. There are inherent risks involved with investing in the stock and options market, including the loss of your investment. Any investment is at your own risk. You should only trade or invest your “risk capital” – money you can afford to lose. Trading stocks and stock options involves high risk, and you can lose the entire principal amount invested or more. There is no guarantee that systems, indicators, or trading signals will result in profits or that they will not produce losses. Chuck Hughes’ profit results are not typical. Chuck Hughes is an experienced investor, and your results will vary depending on risk tolerance, amount of risk capital utilized, size of trading position, willingness to follow the rules and other factors. The actual profit results presented here may vary with the actual profit results presented in other Legacy publications due to the different strategies and time frames presented in other publications. Trading on margin carries a high level of risk and may not be suitable for all investors. Other than the refund policy detailed elsewhere, Legacy does not make any guarantee or other promise as to any results that may be obtained from using the Services. Open trade profit snapshots of Chuck Hughes’ trading accounts represent the open trade profit performance for the trade(s) or the portfolio displayed on the day the snapshot was taken. Open trade profits may have increased or decreased when trades were closed out. Other strategies may not have been profitable during the same time period the open trade profits were displayed. In order to avoid a conflict of interest, Trading Service recommendations were not executed by Chuck Hughes or his associates. The trade entry and exit prices (and resulting profit/loss) represent the price of the security at the time the recommendation was disseminated. Trading Service profits are not based on actual trades and have certain limitations. Because the Trading Service trades have not actually been executed, the results may understate or overstate the impact of certain market factors, such as lack of liquidity. Also, the Trading Service results do not include the costs of subscriptions, commissions, or other fees. No representation is being made that you will achieve profits or the same results as any person providing a testimonial. Testimonials may relate to various other products offered by Legacy Publishing and not the product offered here, but all of these products are based on Chuck Hughes’ system. Performance results of other products described in such testimonials may be different from results for the product being offered and may have been achieved before the product being offered was developed. Results described in testimonials from other products or the product being offered may not be typical or representative of results achieved by other users of such products. No representation is being made that any of the persons who provide testimonials have continued to experience the same level of profitable trading after the date on which the testimonial was provided. In fact, such persons may have experienced losses thereafter or may have experienced losses preceding the period of time referenced in the testimonial. Cash Payout trades receive cash credits from the sale of option premiums. The net profits for Cash Payout trades may be less than the cash received for the sale of the option premium. Some cash income figures presented represent the total amount of option premium collected during the referenced period. Actual profits were less. Auto-trading, or any broker or advisor-directed type of trading, is not supported or endorsed by Legacy Publishing LLC. For additional information on auto-trading, you may visit the SEC’s website: All About Auto-Trading, https://www.sec.gov/reportspubs/investor-publications/investorpubsautotradinghtm.html


Recent Comments