
Dear Reader,
On Friday, we looked at a Monthly Price Chart of Broadcom Inc., noting that the stock’s 1-Month Price is trading above the 10-Month SMA signaling a ‘Buy’.
For today’s Trade of the Day e-letter we will be looking at a monthly chart for Walmart Inc. stock symbol: WMT.
Before breaking down WMT’s monthly chart let’s first review what products and services the company offers.
Walmart Inc. engages in the operation of retail, wholesale, and other units worldwide. The company operates through three segments: Walmart U.S., Walmart International, and Sam’s Club. It operates supercenters, supermarkets, hypermarkets, warehouse clubs, cash and carry stores, and discount stores under Walmart and Walmart Neighborhood Market brands; membership-only warehouse clubs; ecommerce websites, such as walmart.com, walmart.com.mx, walmart.ca, flipkart.com, and samsclub.com; and mobile commerce applications.
Now, let’s begin to break down the monthly chart for WMT stock.
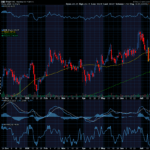
Below is a 10-Month Simple Moving Average chart for Walmart Inc.

Buy WMT Stock
As the chart shows, in October 2022, the WMT 1-Month Price, crossed above the 10-Month simple moving average (SMA).
This crossover indicated the buying pressure for WMT stock exceeded the selling pressure. For this kind of crossover to occur, a stock has to be in a strong bullish uptrend.
Now, as you can see, the 1-Month Price is still above the 10-Month SMA. That means the bullish trend is still in play!
As long as the 1-Month price remains above the 10-Month SMA, the stock is more likely to keep trading at new highs and should be purchased.
Our initial price target for WMT is 165.50 per share.

109.0% Profit Potential for WMT Option
Now, since WMT’s 1-Month Price is trading above the 10-Month SMA this means the stock’s bullish rally will likely continue. Let’s use the Hughes Optioneering calculator to look at the potential returns for a WMT call option purchase.
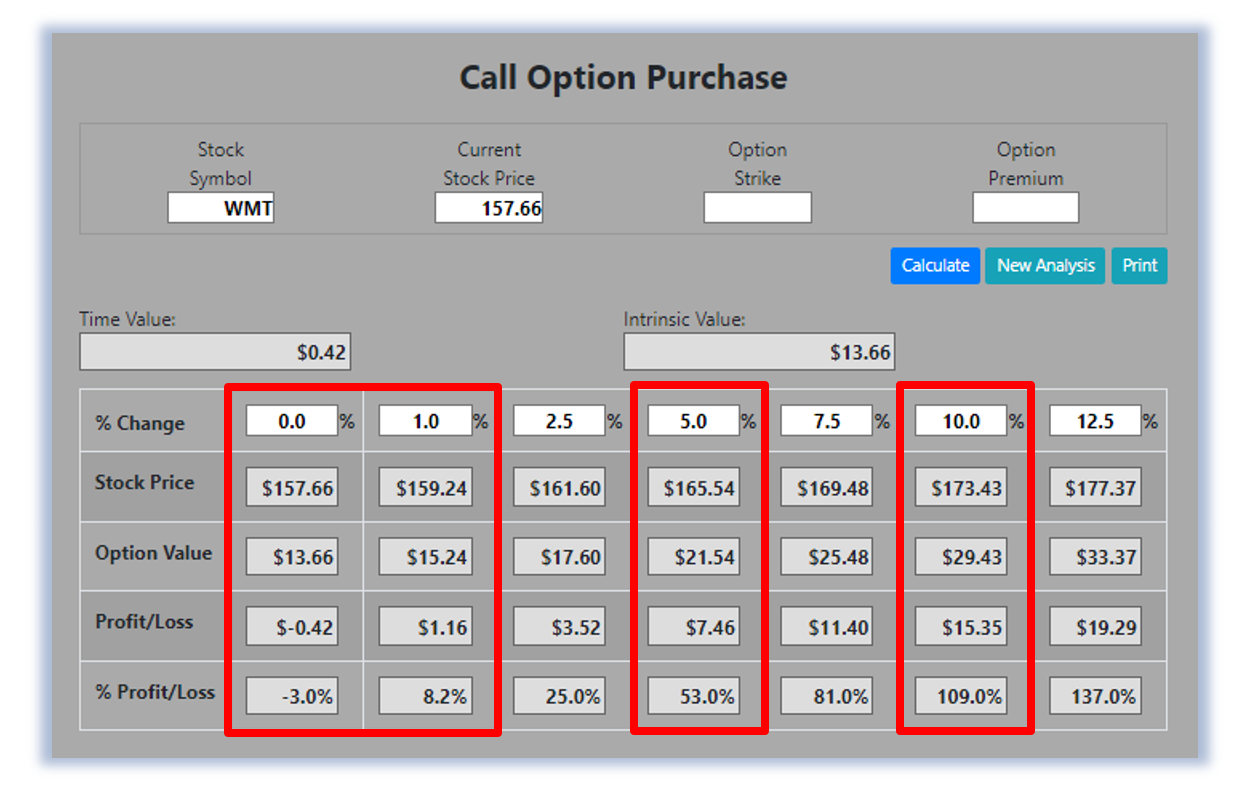
The Call Option Calculator will calculate the profit/loss potential for a call option trade based on the price change of the underlying stock/ETF at option expiration in this example from a flat WMT price to a 12.5% increase.
The Optioneering Team uses the 1% Rule to select an option strike price with a higher percentage of winning trades. In the following WMT option example, we used the 1% Rule to select the WMT option strike price but out of fairness to our paid option service subscribers we don’t list the strike price used in the profit/loss calculation.
Trade with Higher Accuracy
When you use the 1% Rule to select a WMT in-the-money option strike price, WMT stock only has to increase 1% for the option to breakeven and start profiting! Remember, if you purchase an at-the-money or out-of-the-money call option and the underlying stock closes flat at option expiration it will result in a 100% loss for your option trade! In this example, if WMT stock is flat at 157.66 at option expiration, it will only result in a 3.0% loss for the WMT option compared to a 100% loss for an at-the-money or out-of-the-money call option.
Using the 1% Rule to select an option strike price can result in a higher percentage of winning trades compared to at-the-money or out-of-the-money call options. This higher accuracy can give you the discipline needed to become a successful option trader and can help avoid 100% losses when trading options.
The goal of this example is to demonstrate the powerful profit potential available from trading options compared to stocks.
The prices and returns represented below were calculated based on the current stock and option pricing for WMT on 7/5/2023 before commissions.
When you purchase a call option, there is no limit on the profit potential of the call if the underlying stock continues to move up in price.
For this specific call option, the calculator analysis below reveals if WMT stock increases 5.0% at option expiration to 165.54 (circled), the call option would make 53.0% before commission.
If WMT stock increases 10.0% at option expiration to 173.43 (circled), the call option would make 109.0% before commission and outperform the stock return nearly 11 to 1*.
The leverage provided by call options allows you to maximize potential returns on bullish stocks.
The Hughes Optioneering Team is here to help you identify profit opportunities just like this one.
Interested in accessing the Optioneering Calculators? Join one of Chuck’s Trading Services for unlimited access! The Optioneering Team has option calculators for six different option strategies that allow you to calculate the profit potential for an option trade before you take the trade.
Gain Early Access Today!
Chuck Hughes the 10-Time Trading Champion has just launched his exciting brand-new program Lightning Trade Alerts.
Members will get a peek behind the curtain as Chuck will deliver his hand-picked short-term options trades.
Just call Brad at 1-866-661-5664 or 1-310-647-5664 to join or CLICK HERE to schedule a call!
Wishing You the Best in Investing Success,

Chuck Hughes
Editor, Trade of the Day
Have any questions? Email us at dailytrade@chuckstod.com
*Trading incurs risk and some people lose money trading.


Recent Comments