
Dear Reader,
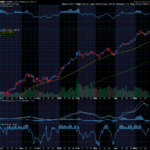
On Friday, we looked at a Daily Price Chart of Agilysys Inc., noting that the stock’s OBV line is sloping up, validating the stock’s recent bullish trend.
For today’s Trade of the Day e-letter we will be looking at a monthly chart for Cloudflare Inc. stock symbol: NET.
Before breaking down NET’s monthly chart let’s first review what products and services the company offers.
CloudFlare, Inc. operates as a cloud services provider that delivers a range of services to businesses worldwide. The company offers an integrated cloud-based security solution to secure a range of combination of platforms, including public cloud, private cloud, on-premise, software-as-a-service applications, and IoT devices. Its security products comprise cloud firewall, bot management, distributed denial of service, IoT, SSL/TLS, secure origin connection, and rate limiting products.
Now, let’s begin to break down the monthly chart for NET stock.
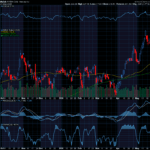
Below is a 10-Month Simple Moving Average chart for Cloudflare Inc.

Sell NET Stock
As the chart shows, in January, the NET 1-Month Price, crossed below the 10-Month simple moving average (SMA).
This crossover indicated the selling pressure for NET stock exceeded the buying pressure. For this kind of crossover to occur, a stock has to be in a strong bearish downtrend.
Now, as you can see, the 1-Month Price is still below the 10-Month SMA. That means the bearish trend is still in play!
As long as the 1-Month price remains below the 10-Month SMA, the stock is more likely to keep trading at new lows and bearish positions should be initiated.
Our initial price target for NET is 41.00 per share.

Profit if NET is Down, Up, or Flat
Now, since NET’s 1-Month Price is trading below the 10-Month SMA, the stock will likely continue its trend downward. Let’s use the Hughes Optioneering calculator to look at the potential returns for a NET put option spread.
The Put Option Spread Calculator will calculate the profit/loss potential for a put option spread based on the price change of the underlying stock/ETF at option expiration in this example from a 10.0% decrease to a 10.0% increase in NET stock at option expiration.
The goal of this example is to demonstrate the ‘built in’ profit potential for option spreads and the ability of spreads to profit if the underlying stock is down, up, or flat at option expiration. Out of fairness to our paid option service subscribers we don’t list the option strike prices used in the profit/loss calculation.
The prices and returns represented below were calculated based on the current stock and option pricing for NET on 11/21/2022 before commissions.
Built in Profit Potential
For this option spread, the calculator analysis below reveals the cost of the spread is $333 (circled). The maximum risk for an option spread is the cost of the spread.
The analysis reveals that if NET stock is flat or down at all at expiration the spread will realize a 50.2% return (circled).
And if NET stock increases 10.0% at option expiration, the option spread would make a 50.2% return (circled).
Due to option pricing characteristics, this option spread has a ‘built in’ 50.2% profit potential when the trade was identified*.
Option spread trades can result in a higher percentage of winning trades compared to a directional option trade if you can profit when the underlying stock/ETF is up, down or flat.
A higher percentage of winning trades can give you the discipline needed to become a successful trader.
The Hughes Optioneering Team is here to help you identify profit opportunities just like this one.

Interested in accessing the Optioneering Calculators? Join one of Chuck’s Trading Services for unlimited access! The Optioneering Team has option calculators for six different option strategies that allow you to calculate the profit potential for an option trade before you take the trade.
Trade High Priced Stocks for $350 With Less Risk
One of the big advantages to trading option spreads is that spreads allow you to trade high price stocks like Amazon, Google, Netflix or Apple for as little as $350. With an option spread you can control 100 shares of Netflix for $350. If you were to purchase 100 shares of Netflix at current prices it would cost about $28,000. With the stock purchase you are risking $28,000 but with a Netflix option spread that costs $350 your maximum risk is $350 so your dollar risk is lower with option spreads compared to stock purchases.
Get Trade Insights Directly From Chuck
You can start getting market insights directly from 10-Time Trading Champion Chuck Hughes.
See what he’s trading and when with his exclusive Inner Circle Trading Service where he will send you his hand-picked stock and option trades.
Just call Brad at 1-866-661-5664 or 1-310-647-5664 to join or CLICK HERE to schedule a call!
Wishing You the Best in Investing Success,

Chuck Hughes
Editor, Trade of the Day
Have any questions? Email us at dailytrade@chuckstod.com
*Trading incurs risk and some people lose money trading.


Recent Comments