
The TSI Indicator spotted a 93% potential profit. Check out how it works below.
It brings me joy to share that you don’t need special education or to sit in front of the computer all day to trade options. It can be easily learned if you are interested in spending an hour or so a week earning money in what could be considered “renting” stocks for a short period of time.
This is why I show you the details about an equity’s symbol and pattern each week.
I am typing this on Sunday. The S&P was down 4 out of 5 days last week.
Prudential Profit Potential
For today’s potential Trade of the Day, we will be looking at Prudential. (PRU).
Before analyzing PRU’s chart, let’s take a closer look at the company and its services.
Prudential Financial, Inc., together with its subsidiaries, provides insurance, investment management, and other financial products and services in the United States and internationally. It operates through eight segments: PGIM, Retirement, Group Insurance, Individual Annuities, Individual Life, Assurance IQ, International Businesses, and Closed Block. The company offers investment management services and solutions related to public fixed income, public equity, real estate debt and equity, private credit and other alternatives, and multi-asset class strategies to institutional and retail clients, as well as its general account. It also provides a range of retirement investment, and income products and services to retirement plan sponsors in the public, private, and not-for-profit sectors; and group life, long-term and short-term group disability, and group corporate-, bank-, and trust-owned life insurance in the United States, primarily to institutional clients for use in connection with employee and membership benefits plans, as well as sells accidental death and dismemberment, and other supplemental health solutions; and provides plan administration services in connection with its insurance coverages.
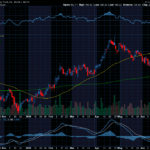
Each candle on the weekly chart represents price movement over a 5-day (week) period. The indicator at the bottom of the chart is a True Strength Indicator (TSI). The description coming up next explains how to use the TSI.
True Strength Indicator
Stockcharts.com provides a great definition of the True Strength Index (TSI), which is an oscillator that fluctuates between positive and negative territory. As with many momentum oscillators, the centerline defines the overall bias. The bulls have the momentum edge when TSI is positive, and the bears have the edge when it’s negative.
As with PPO, a signal line can be applied to identify upturns and downturns. Signal line crossovers are, however, quite frequent and require further filtering with other techniques. Chart readers can also look for bullish and bearish divergences to anticipate trend reversals; however, keep in mind that divergences can be misleading in a strong trend.
TSI is somewhat unique because it tracks the underlying price quite well. In other words, the oscillator can capture a sustained move in one direction or the other. The peaks and troughs in the oscillator often match the peaks and troughs in price. In this regard, chart readers can draw trend lines and mark support/resistance levels using TSI. Line breaks as well as line crosses can then be used to generate signals.


A cross up through the TSI red signal is bullish, in that it is suggesting price has gone from bearish to bullish. A cross down through the red line suggests price is bearish. If you want to learn more about the TSI, you can read through the short section below, or you can scroll down to the alert signal.
Check Out How an Option Trade Could Pay Out Big Time
Potential PRU Trade:
If PRU’s price continues to move DOWN, you could consider a Put trade. I am writing this on Sunday, if price continues to move to $100 when you receive this on Tuesday, you could consider a put option trade. We are expecting the TSI indicator to continue to head down.
PRU’s is bearish as it crossed below the red signal line. The past several weeks candles are bearish. The short-term target is $95 and then lower.
These examples are provided to show how options work and the advantages they offer.
To buy shares of PRU stock today, it would cost approximately $101 per share. You would wait until you thought it hit a bottom before you bought stock.
Option trading offers the potential of a lower initial investment and higher percentage gain. It is like renting stock versus buying out right. Let’s take a look.
If you bought one Put option contract covering 100 shares of PRU’s stock with a June 17th expiration date for the 95-strike, the premium would be approximately $2.70 per share, or a total of $270 for the contract of 100 shares. If price fell the expected $5 over the next few weeks, the premium would likely increase approximately $2.50 to $5.20. This is a gain of 93% profit. That would be a nice trade over a short period of time!
It is exciting to make money if price rises or falls.
I want to remind you that you can sell to close and take profit any time along the line before the expiration date. You don’t have to hold the contract until expiration.
Options often offer a smaller overall investment, covering more shares of stock and potential for greater profits. This is like renting stocks versus having to pay full price to buy.
For updates on previous potential trades we have discussed, scroll to the bottom of this message.
I love to trade, and I love to teach. It is my thing. I am truly thankful for you and your efforts.
Being thankful is one of the strongest and most transforming states of being. It shifts your perspective from lack to abundance and allows you to focus on the good in your life, which in turn pulls more blessings into your reality.
I send you wishes for the very best,
Wendy

Past potential trade update:
Last week, we discussed buying TWTR calls. I did not hit the target entry price. No trade would have been taken.


How do you write a put trade?