
Dear Reader,
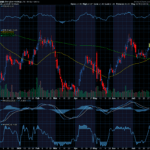
Yesterday, we looked at a Daily Price Chart of the VanEck Vectors Semiconductor ETF, noting that SMH has been making a series of new 52-Week Highs.
For today’s Trade of the Day e-letter we will be looking at a monthly chart for RadNet, Inc. stock symbol: RDNT.
Before breaking down RDNT’s monthly chart let’s first review what products and services the company offers.
RadNet, Inc., is a national market leader providing high-quality, cost-effective diagnostic imaging services through a network of fully-owned and operated outpatient imaging centers. RadNet offers to its patients and referring physicians the full spectrum of diagnostic imaging exams, including PET/CT, MRI, CT, Nuclear Medicine, Mammography, Ultrasound and X-ray.
Now, let’s begin to break down the monthly chart for RDNT stock.
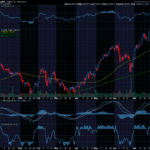
Below is a 10-Month Simple Moving Average chart for RadNet, Inc.
Are you struggling to navigate the complexities of options trading? Feeling overwhelmed by the risks and uncertainties in the market? Introducing Options Trading Made Easy!

Buy RDNT Stock
As the chart shows, in November, the RDNT 1-Month Price, crossed above the 10-Month simple moving average (SMA).
This crossover indicated the buying pressure for RDNT stock exceeded the selling pressure. For this kind of crossover to occur, a stock has to be in a strong bullish uptrend.
Now, as you can see, the 1-Month Price is still above the 10-Month SMA. That means the bullish trend is still in play!
As long as the 1-Month price remains above the 10-Month SMA, the stock is more likely to keep trading at new highs and should be purchased.
Our initial price target for RDNT is 62.50 per share.
109.1% Profit Potential for RDNT Option
Now, since RDNT’s 1-Month Price is trading above the 10-Month SMA this means the stock’s bullish rally will likely continue. Let’s use the Hughes Optioneering calculator to look at the potential returns for an RDNT call option purchase.
The Call Option Calculator will calculate the profit/loss potential for a call option trade based on the price change of the underlying stock/ETF at option expiration in this example from a flat RDNT price to a 12.5% increase.
The Optioneering Team uses the 1% Rule to select an option strike price with a higher percentage of winning trades. In the following RDNT option example, we used the 1% Rule to select the RDNT option strike price but out of fairness to our paid option service subscribers we don’t list the strike price used in the profit/loss calculation.
Trade with Higher Accuracy
When you use the 1% Rule to select a RDNT in-the-money option strike price, RDNT stock only has to increase 1% for the option to breakeven and start profiting! Remember, if you purchase an at-the-money or out-of-the-money call option and the underlying stock closes flat at option expiration it will result in a 100% loss for your option trade! In this example, if RDNT stock is flat at 59.41 at option expiration, it will only result in a 10.9% loss for the RDNT option compared to a 100% loss for an at-the-money or out-of-the-money call option.
Using the 1% Rule to select an option strike price can result in a higher percentage of winning trades compared to at-the-money or out-of-the-money call options. This higher accuracy can give you the discipline needed to become a successful option trader and can help avoid 100% losses when trading options.
The goal of this example is to demonstrate the powerful profit potential available from trading options compared to stocks.
The prices and returns represented below were calculated based on the current stock and option pricing for RDNT on 5/28/2024 before commissions.
When you purchase a call option, there is no limit on the profit potential of the call if the underlying stock continues to move up in price.
For this specific call option, the calculator analysis below reveals if RDNT stock increases 5.0% at option expiration to 62.38 (circled), the call option would make 49.1% before commission.
If RDNT stock increases 10.0% at option expiration to 65.35 (circled), the call option would make 109.1% before commission and outperform the stock return nearly 11 to 1*.
The leverage provided by call options allows you to maximize potential returns on bullish stocks.
The Hughes Optioneering Team is here to help you identify profit opportunities just like this one.

Interested in accessing the Optioneering Calculators? Join one of Chuck’s Trading Services for unlimited access! The Optioneering Team has option calculators for six different option strategies that allow you to calculate the profit potential for an option trade before you take the trade.
Check out Chuck’s PRO Trading Service!
I don’t want you to miss a single opportunity to potentially reach your goals. That’s why I want to share this video I made about my PRO Trading Service.
I want you to follow in my footsteps for the opportunity to succeed beyond your wildest dreams, so please call my office at (737) 292-4425 and get started today!
Wishing You the Best in Investing Success,

Chuck Hughes
Editor, Trade of the Day
Have any questions? Email us at dailytrade@chuckstod.com
*Trading incurs risk and some people lose money trading.


Recent Comments