

The darlings of the market are due to report this week and it is on the heels of a down week already. If you are looking to figure out what to expect, there are some places to look for clues. One indicator that I turn to for a sign of where momentum is taking the markets is Bollinger Bands. I have shared this great explanation of how they work in the past, it is worth a look.
This overlay is relatively simple to read and can tell give you a heads up if this drop is likely to continue or if it is staging another rebound.
Here is a chart of the NASDAQ and what the Bollinger Bands tell us.
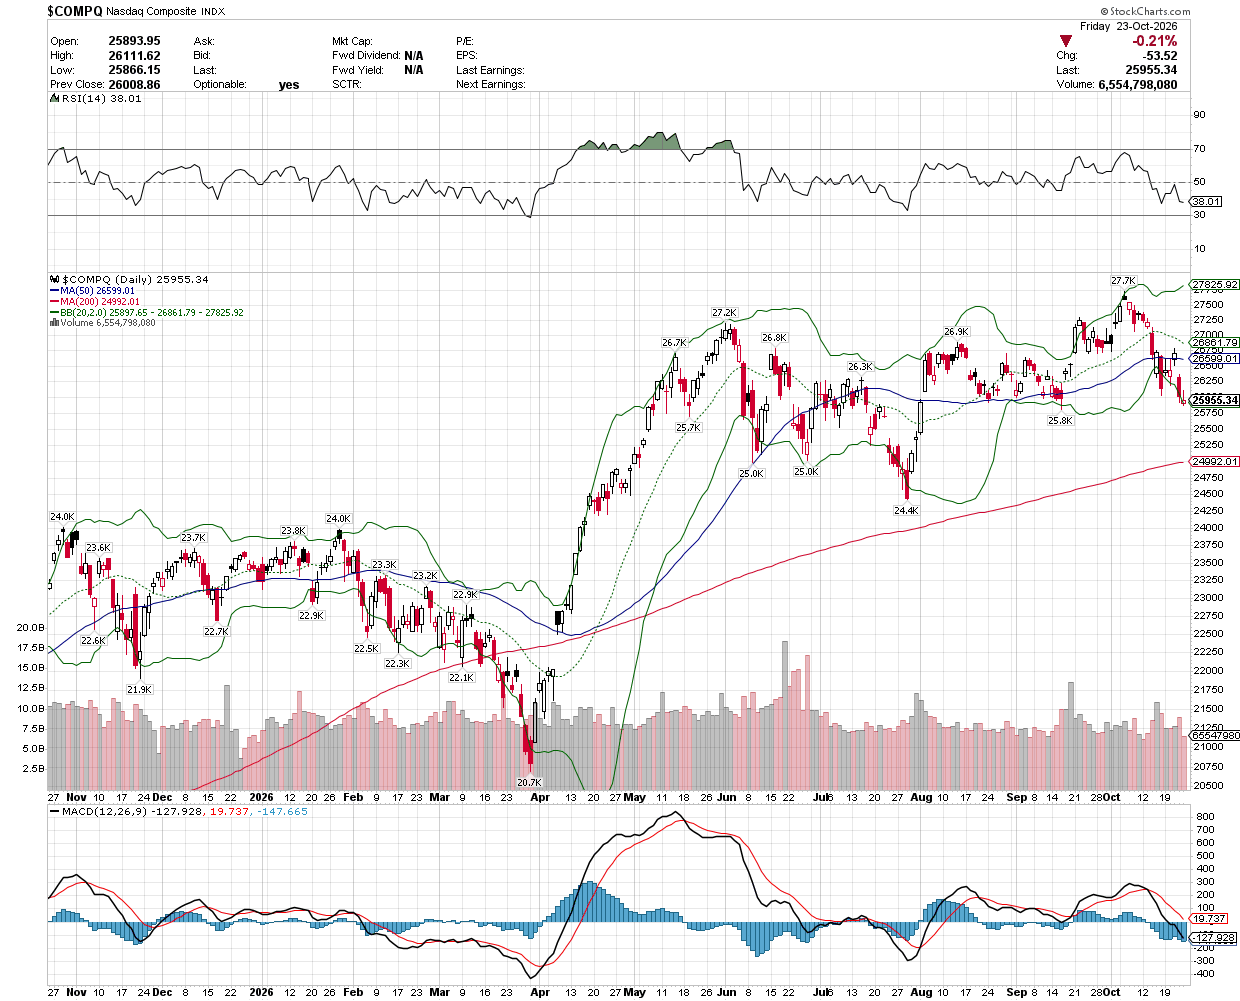
We can see that when a ticker is below the center dotted line, the momentum is downward. The price will gravitate to the bottom band until it reverse. The sign of a reversal is usually a move above the center dotted line. At that point it will continue to gravitate high until it breaks, and closes below the center band.
The caveat is that quick moves can occasionally revers the stock with little warning. But as the ticker offers strong trends, this indicator can virtually be a crystal ball of what to expect.
Make sure you check that full update to get all of the details.
Wishing you the best,
Wendy











Recent Comments