
Dear Reader,
Yesterday, we looked at a Daily Price Chart of Cadence Design Systems, Inc., noting that CDNS’s 50-Day EMA is trading above the 100-Day EMA.
For today’s Trade of the Day we will be looking at a Daily Price chart for Synopsys, Inc., stock symbol: SNPS.
Before breaking down SNPS’s daily price chart let’s first review which products and services are offered by the company.
Synopsys, Inc. provides electronic design automation software products used to design and test integrated circuits. The company offers Digital and Custom IC Design solution that provides digital design implementation solutions; Verification solution that offers virtual prototyping, static and formal verification, simulation, emulation, field programmable gate array based prototyping, and debug solutions; and FPGA design products that are programmed to perform specific functions.
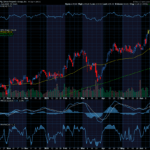
Now, let’s begin to break down the Daily Price chart for SNPS. Below is a Daily Price Chart with the price line displayed by an OHLC bar.

Buy SNPS Stock
The Daily Price chart above shows that SNPS stock has been hitting new 52-Week Highs regularly this week.
Simply put, a stock does not just continually hit a series of new 52-Week Highs unless it is in a very strong bullish trend.
The Hughes Optioneering team looks for stocks that are making a series of 52-Week Highs as this is a good indicator that the stock is in a powerful uptrend.
You see, after a stock makes a series of two or more 52-Week Highs, the stock typically continues its price uptrend and should be purchased.
Our initial price target for SNPS stock is 510.00 per share.
Profit if SNPS is Up, Down or Flat
Now, since SNPS stock is currently making a series of new 52-Week Highs and will likely rally from here, let’s use the Hughes Optioneering calculator to look at the potential returns for a SNPS call option spread.
The Call Option Spread Calculator will calculate the profit/loss potential for a call option spread based on the price change of the underlying stock/ETF at option expiration in this example from a 7.5% increase to a 7.5% decrease in SNPS at option expiration.
The goal of this example is to demonstrate the ‘built in’ profit potential for option spreads and the ability of spreads to profit if the underlying stock is up, down or flat at option expiration. Out of fairness to our paid option service subscribers we don’t list the option strike prices used in the profit/loss calculation.
The prices and returns represented below were calculated based on the current stock and option pricing for SNPS on 10/11/2023 before commissions.
Built in Profit Potential
For this option spread, the calculator analysis below reveals the cost of the spread is $665 (circled). The maximum risk for an option spread is the cost of the spread.
The analysis reveals that if SNPS stock is flat or up at all at expiration the spread will realize a 50.4% return (circled).
And if SNPS stock decreases 7.5% at option expiration, the option spread would make a 17.7% return (circled).
Due to option pricing characteristics, this option spread has a ‘built in’ 50.4% profit potential when the trade was identified*.
Option spread trades can result in a higher percentage of winning trades compared to a directional option trade if you can profit when the underlying stock/ETF is up, down or flat.
A higher percentage of winning trades can give you the discipline needed to become a successful trader.
The Hughes Optioneering Team is here to help you identify profit opportunities just like this one.

Interested in accessing the Optioneering Calculators? Join one of Chuck’s Trading Services for unlimited access! The Optioneering Team has option calculators for six different option strategies that allow you to calculate the profit potential for an option trade before you take the trade.
Trade High Priced Stocks for $350 With Less Risk
One of the big advantages to trading option spreads is that spreads allow you to trade high price stocks like Amazon, Google, or Netflix for as little as $350. With an option spread you can control 100 shares of Netflix for $350. If you were to purchase 100 shares of Netflix at current prices it would cost about $36,000. With the stock purchase you are risking $36,000 but with a Netflix option spread that costs $350 your maximum risk is $350 so your dollar risk is lower with option spreads compared to stock purchases.
Check Out What Chuck’s Trading
Interested in seeing stock and option trades that I pick? I have a trading service where you can do just that.
See what I’m trading and when with my exclusive Weekly Option Alert Trading Service where I’ll will send you my hand-picked stock and option trades.
Just call Brad at 1-866-661-5664 or 1-310-647-5664 to join or CLICK HEREto schedule a call!
Wishing You the Best in Investing Success,

Chuck Hughes
Editor, Trade of the Day
Have any questions? Email us at dailytrade@chuckstod.com
*Trading incurs risk and some people lose money trading.


Recent Comments