
Dear Reader,
Yesterday, we looked at a Daily Price Chart of Harrow Health Inc., noting the stock has been making a series of higher highs and higher lows.
For today’s Trade of the Day we will be looking at an On Balance Volume chart for e.l.f. Beauty, Inc. stock symbol: ELF.
Before breaking down ELF’s OBV chart let’s first review which products and services are offered by the company.
e.l.f. Beauty, Inc., together with its subsidiaries, provides cosmetic and skin care products under the e.l.f. Cosmetics, e.l.f. Skin, Well People, and Keys Soulcare brand names worldwide. The company offers eye, lip, face, face, paw, and skin care products. It sells its products through national and international retailers and direct-to-consumer channels, which include e-commerce platforms in the United States, and internationally primarily through distributors.
Confirming a Price Uptrend with OBV
The ELF daily price chart below shows that ELF is in a price uptrend as the current price is above the price ELF traded at six months ago (circled). The On Balance Volume chart is below the daily chart.
On Balance Volume measures volume flow with a single Easy-to-Read Line. Volume flow precedes price movement and helps sustain the price downtrend. When a stock closes up, volume is added to the line. When a stock closes down, volume is subtracted from the line. A cumulative total of these additions and subtractions form the OBV line.
On Balance Volume Indicator
● When Close is Up, Volume is Added
● When Close is Down, Volume is Subtracted
● A Cumulative Total of Additions and Subtractions form the OBV Line
Volume flow precedes price and is the key to measuring the validity and sustainability of a price trend.
We can see from the OBV chart below that the On Balance Volume line for ELF is sloping up. An up-sloping line indicates that the volume is heavier on up days and buying pressure is exceeding selling pressure. Buying pressure must continue to exceed selling pressure in order to sustain a price uptrend. So, On Balance Volume is a simple indicator to use that confirms the price uptrend and its sustainability.
The numerical value of the On Balance Volume line is not important. We simply want to see an up-sloping line to confirm a price uptrend.

Confirmed ‘Buy’ Signal for ELF
Since ELF’s OBV line is sloping up, the most likely future price movement for ELF is up, making ELF a good candidate for a stock purchase or a call option spread.
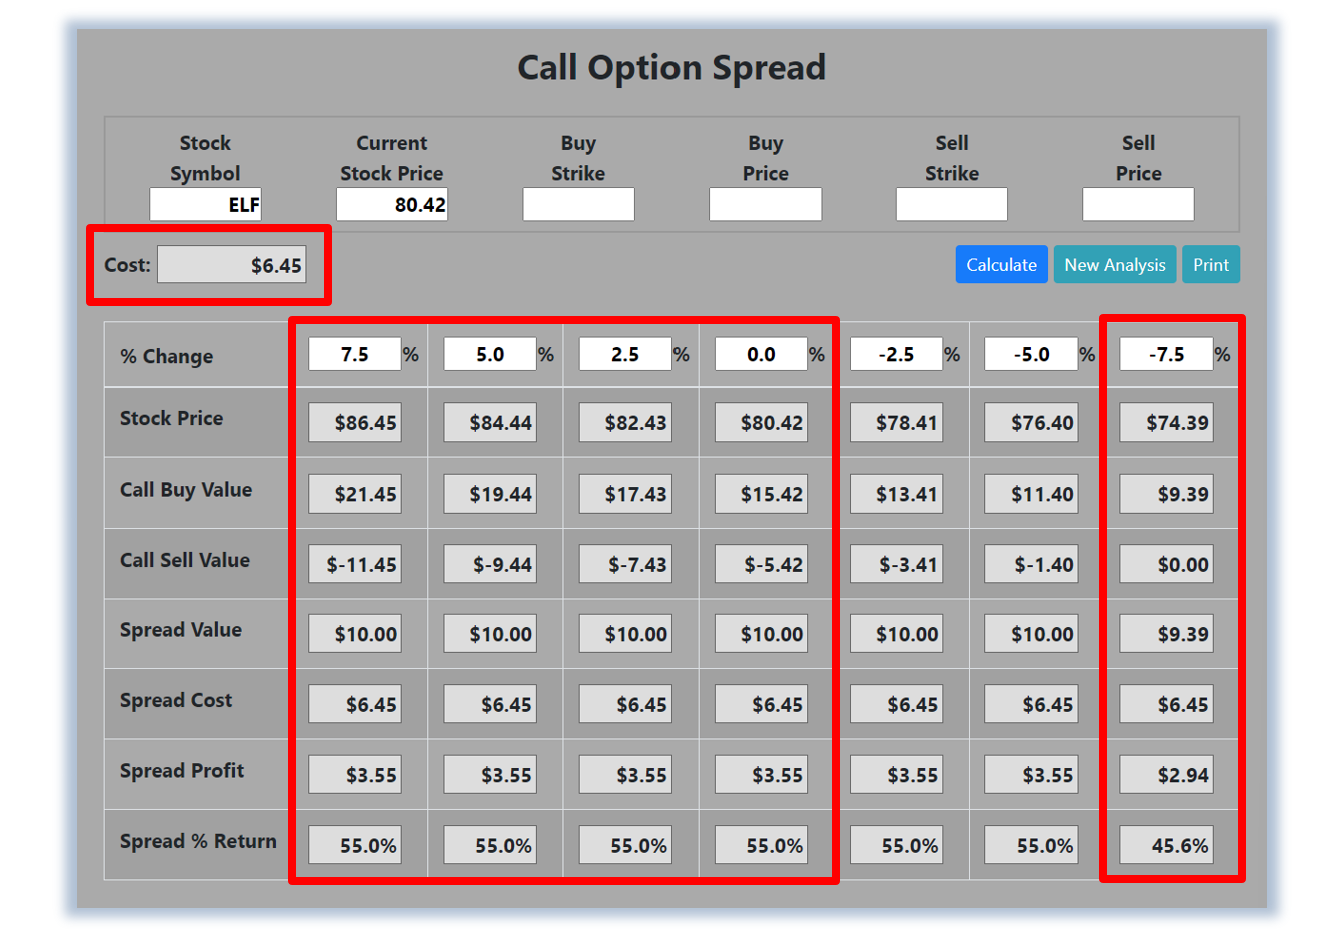
Let’s use the Hughes Optioneering calculator to look at the potential returns for an ELF debit spread.
The Call Option Spread Calculator will calculate the profit/loss potential for a call option spread based on the price change of the underlying stock/ETF at option expiration in this example from a 7.5% increase to a 7.5% decrease in ELF stock at option expiration.
The goal of this example is to demonstrate the ‘built in’ profit potential for option spreads and the ability of spreads to profit if the underlying stock is up, down or flat at option expiration. Out of fairness to our paid option service subscribers we don’t list the option strike prices used in the profit/loss calculation.
The prices and returns represented below were calculated based on the current stock and option pricing for ELF on 3/29/2023 before commissions.

Built in Profit Potential
For this option spread, the calculator analysis below reveals the cost of the spread is $645 (circled). The maximum risk for an option spread is the cost of the spread.
The analysis reveals that if ELF stock is flat or up at all at expiration the spread will realize a 55.0% return (circled).
And if ELF stock decreases 7.5% at option expiration, the option spread would make a 45.6% return (circled).
Due to option pricing characteristics, this option spread has a ‘built in’ 55.0% profit potential when the trade was identified*.
Option spread trades can result in a higher percentage of winning trades compared to a directional option trade if you can profit when the underlying stock/ETF is up, down or flat.
A higher percentage of winning trades can give you the discipline needed to become a successful trader.
The Hughes Optioneering Team is here to help you identify profit opportunities just like this one.
Interested in accessing the Optioneering Calculators? Join one of Chuck’s Trading Services for unlimited access! The Optioneering Team has option calculators for six different option strategies that allow you to calculate the profit potential for an option trade before you take the trade.
Trade High Priced Stocks for $350 With Less Risk
One of the big advantages to trading option spreads is that spreads allow you to trade high price stocks like Amazon, Google, or Netflix for as little as $350. With an option spread you can control 100 shares of Netflix for $350. If you were to purchase 100 shares of Netflix at current prices it would cost about $33,000. With the stock purchase you are risking $33,000 but with a Netflix option spread that costs $350 your maximum risk is $350 so your dollar risk is lower with option spreads compared to stock purchases.
Chuck’s $3,000 Trading Scholarship
I don’t want you to miss a single opportunity to potentially reach your goals. That’s why I’d like to offer you a scholarship of the full $3,000 Enrollment Fee of my exclusive Inner Circle Trading Service**.
I want you to follow in my footsteps and succeed beyond your wildest dreams, so please call Brad in my office at 1-866-661-5664 or 1-310-647-5664 and get started today!
You can also click below to schedule a call now!

Wishing You the Best in Investing Success,

Chuck Hughes
Editor, Trade of the Day
Have any questions? Email us at dailytrade@chuckstod.com
*Trading incurs risk and some people lose money trading.
** Inner Circle Trading Service program provides training package and specific trade signals for one year. The first 10 people to sign up each day this offer is valid, will get a waiver of the standard fee, which is the price charged to anyone signing up after the first 10 people per day.


Recent Comments