
Dear Reader,
On Friday, we looked at a Daily Price Chart of Cheniere Energy, Inc., noting that the stock has been making a series of 52-Week Highs recently.
For today’s Trade of the Day e-letter we will be looking at a Moving Average Convergence/ Divergence (MACD) chart for MGP Ingredients, Inc. stock symbol: MGPI.
Before breaking down MGPI’s MACD chart let’s first review what products and services the company offers.
MGP Ingredients, Inc., together with its subsidiaries, produces and supplies distilled spirits, branded spirits, and food ingredients. It operates through three segments: Distillery Products; Branded Spirits; and Ingredient Solutions. The Distillery Products segment provides food grade alcohol for beverage applications that include bourbon and rye whiskeys, as well as grain neutral spirits, including vodka and gin; and food-grade industrial alcohol, which is used as an ingredient in foods, personal care products, cleaning solutions, pharmaceuticals, and various other products.
MACD Indicator confirms Price Momentum
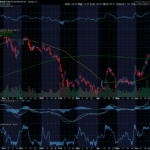
The MGPI daily price chart below shows that MGPI is in a price uptrend as the 24/52 day MACD line (black line) is above the 18-Day EMA (purple line). The Moving Average Convergence/ Divergence chart is shown below the daily price chart.
MACD uses moving averages to create a momentum indicator by subtracting the longer-term moving average from the shorter-term moving average. The MACD is calculated by subtracting a stock’s longer term 52-Day Exponential Moving Average (EMA) from its shorter term 24-Day EMA. This creates the MACD line.
MACD ‘Buy’ Signal
The 18-Day EMA line functions as a buy/sell ‘trigger’. When the 24/52 Day MACD line crosses above the 18-Day EMA line it indicates positive momentum and higher prices for the stock. When the 24/52 Day MACD lines crosses below the 18-Day EMA it indicates negative momentum and lower prices for the stock. MACD is more of a leading indicator than a moving average cross over which tends to lag price movement.
MACD Histogram shows Acceleration of Momentum
Also included in a MACD chart is the histogram bar graph. This portion of the chart helps to illustrate the distance between the 24/52 Day MACD and the 18-Day EMA.
When a crossover initially occurs, the histogram’s bar will be near flat as the two indicator lines have converged. As the lines begin to separate, the bars grow in height, indicating a widening gap and acceleration for the stock’s momentum. When the histogram’s bars begin to shrink this indicates a narrowing of the gap between the 24/52 Day MACD and the 18-Day EMA and a slowing of the stock’s momentum. When the gap between the two indicators begins to narrow, this typically indicates a crossover of the indicator lines could happen soon.

Buy MGPI Stock
As long as the 24/52 Day MACD line remains above the 18-Day EMA, the stock is more likely to keep trading at new highs in the coming days and weeks.
Since MGPI’s bullish run is likely to continue, the stock should be purchased.
Our initial price target for MGPI stock is 117.00 per share.

108.4% Profit Potential for MGPI Option
Now, since MGPI’s 24/52 Day MACD is trading above the 18-Day EMA this means the stock’s bullish rally will likely continue. Let’s use the Hughes Optioneering calculator to look at the potential returns for a MGPI call option purchase.
The Call Option Calculator will calculate the profit/loss potential for a call option trade based on the price change of the underlying stock/ETF at option expiration in this example from a flat MGPI price to a 12.5% increase.
The Optioneering Team uses the 1% Rule to select an option strike price with a higher percentage of winning trades. In the following MGPI option example, we used the 1% Rule to select the MGPI option strike price but out of fairness to our paid option service subscribers we don’t list the strike price used in the profit/loss calculation.
Trade with Higher Accuracy
When you use the 1% Rule to select a MGPI in-the-money option strike price, MGPI stock only has to increase 1% for the option to breakeven and start profiting! Remember, if you purchase an at-the-money or out-of-the-money call option and the underlying stock closes flat at option expiration it will result in a 100% loss for your option trade! In this example, if MGPI stock is flat at 110.14 at option expiration, it will only result in a 0.1% loss for the MGPI option compared to a 100% loss for an at-the-money or out-of-the-money call option.
Using the 1% Rule to select an option strike price can result in a higher percentage of winning trades compared to at-the-money or out-of-the-money call options. This higher accuracy can give you the discipline needed to become a successful option trader and can help avoid 100% losses when trading options.
The goal of this example is to demonstrate the powerful profit potential available from trading options compared to stocks.
The prices and returns represented below were calculated based on the current stock and option pricing for MGPI on 8/14/2022 before commissions.
When you purchase a call option, there is no limit on the profit potential of the call if the underlying stock continues to move up in price.
For this specific call option, the calculator analysis below reveals if MGPI stock increases 5.0% at option expiration to 115.65 (circled), the call option would make 54.2% before commission.
If MGPI stock increases 10.0% at option expiration to 121.15 (circled), the call option would make 108.4% before commission and outperform the stock return nearly 11 to 1*.
The leverage provided by call options allows you to maximize potential returns on bullish stocks.
The Hughes Optioneering Team is here to help you identify profit opportunities just like this one.

Interested in accessing the Optioneering Calculators? Join one of Chuck’s Trading Services for unlimited access! The Optioneering Team has option calculators for six different option strategies that allow you to calculate the profit potential for an option trade before you take the trade.
Optioneering Strategies Are Designed to Perform In Bull, Bear or Flat Markets
This isn’t Chuck’s first bear market…
Over the past 20+ years, Chuck’s strategies have proven to perform, even in the most volatile markets.
His strategies championed market corrections, the Dot-Com Crash, and the 2008 Great Recession*.
This is your chance to gain access to his proven strategies and start receiving hand-picked trades from 10-Time Trading Champion!
Just call Brad at 1-866-661-5664 or 1-310-647-5664 to join his Weekly Option Alert Trading Service and use the code “Optioneering VIP” to receive special pricing.
You can also CLICK HERE to schedule a call!
Wishing You the Best in Investing Success,
Chuck Hughes
Editor, Trade of the Day
Have any questions? Email us at dailytrade@chuckstod.com
*Trading incurs risk and some people lose money trading.


Recent Comments