
Dear Reader,
Yesterday, we looked at a Daily Price Chart of Welltower Inc. noting the stock’s OBV line is sloping down, validating the recent bearish trend.
For today’s Trade of the Day we will be looking at a Daily Price chart for Salesforce.com, Inc. stock symbol: CRM.
Before breaking down CRM’s daily price chart let’s first review which products and services are offered by the company.
Salesforce, Inc. provides customer relationship management technology that brings companies and customers together worldwide. Its Customer 360 platform empowers its customers to work together to deliver connected experiences for their customers. The company’s service offerings include Sales to store data, monitor leads and progress, forecast opportunities, gain insights through analytics and relationship intelligence, and deliver quotes, contracts, and invoices; and Service that enables companies to deliver trusted and highly personalized customer service and support at scale.
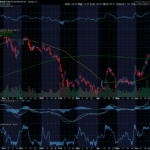
Now, let’s begin to break down the Daily Price chart for CRM. Below is a Daily Price Chart with the price line displayed by an OHLC bar.

Sell CRM Stock
The Daily Price chart above shows that CRM stock has been hitting new 52-Week Lows regularly since early December.
Simply put, a stock does not just continually hit a series of new 52-Week Lows unless it is in a very strong bearish trend.
The Hughes Optioneering team looks for stocks that are making a series of 52-Week Lows as this is a good indicator that the stock is in a powerful downtrend.
You see, after a stock makes a series of two or more 52-Week Lows, the stock typically continues its price downtrend and bearish positions should be initiated.
Our initial price target for CRM stock is 124.00 per share.

Profit if CRM is Down, Up, or Flat
Now, since CRM stock is making a series of new 52-Week Highs, the stock will likely continue its trend downward. Let’s use the Hughes Optioneering calculator to look at the potential returns for a CRM put option spread.
The Put Option Spread Calculator will calculate the profit/loss potential for a put option spread based on the price change of the underlying stock/ETF at option expiration in this example from a 10.0% decrease to a 10.0% increase in CRM stock at option expiration.
The goal of this example is to demonstrate the ‘built in’ profit potential for option spreads and the ability of spreads to profit if the underlying stock is down, up, or flat at option expiration. Out of fairness to our paid option service subscribers we don’t list the option strike prices used in the profit/loss calculation.
The prices and returns represented below were calculated based on the current stock and option pricing for CRM on 12/21/2022 before commissions.
Built in Profit Potential
For this option spread, the calculator analysis below reveals the cost of the spread is $330 (circled). The maximum risk for an option spread is the cost of the spread.
The analysis reveals that if CRM stock is flat or down at all at expiration the spread will realize a 51.5% return (circled).
And if CRM stock increases 10.0% at option expiration, the option spread would make a 51.5% return (circled).
Due to option pricing characteristics, this option spread has a ‘built in’ 51.5% profit potential when the trade was identified*.
Option spread trades can result in a higher percentage of winning trades compared to a directional option trade if you can profit when the underlying stock/ETF is up, down or flat.
A higher percentage of winning trades can give you the discipline needed to become a successful trader.
The Hughes Optioneering Team is here to help you identify profit opportunities just like this one.

Interested in accessing the Optioneering Calculators? Join one of Chuck’s Trading Services for unlimited access! The Optioneering Team has option calculators for six different option strategies that allow you to calculate the profit potential for an option trade before you take the trade.
Trade High Priced Stocks for $350 With Less Risk
One of the big advantages to trading option spreads is that spreads allow you to trade high price stocks like Amazon, Google, Netflix or Apple for as little as $350. With an option spread you can control 100 shares of Netflix for $350. If you were to purchase 100 shares of Netflix at current prices it would cost about $30,000. With the stock purchase you are risking $30,000 but with a Netflix option spread that costs $350 your maximum risk is $350 so your dollar risk is lower with option spreads compared to stock purchases.
Get Trade Insights Directly From Chuck
You can start getting market insights directly from 10-Time Trading Champion Chuck Hughes.
See what he’s trading and when with his exclusive Inner Circle Trading Service where he will send you his hand-picked stock and option trades.
Just call Brad at 1-866-661-5664 or 1-310-647-5664 to join or CLICK HERE to schedule a call!
Wishing You the Best in Investing Success,

Chuck Hughes
Editor, Trade of the Day
Have any questions? Email us at dailytrade@chuckstod.com
*Trading incurs risk and some people lose money trading.


Recent Comments