| Monday, May 26th, 2021 |
| Well-known Communication Company Climbs Higher |
Happy Wonderful Wednesday!
The fourth week in May started off showing bullishness as the indices opened up. Last week was split, three days down and two up, recovering about half the drop. The start to this week is taking back the last of the decline.
To review past equity candidates, scroll down. Several are also hitting all-time highs!
For today’s Trade of the Day, we will be looking at Facebook, symbol (FB). Before analyzing FBs chart, let’s take a closer look at the stock and its services.
Facebook, Inc. develops products that enable people to connect and share with friends and family through mobile devices, personal computers, virtual reality headsets, and in-home devices worldwide. The company’s products include Facebook that enables people to connect, share, discover, and communicate with each other on mobile devices and personal computers; Instagram, a community for sharing photos, videos, and private messages.
Facebook, Inc. was founded in 2004 and is headquartered in Menlo Park, California.
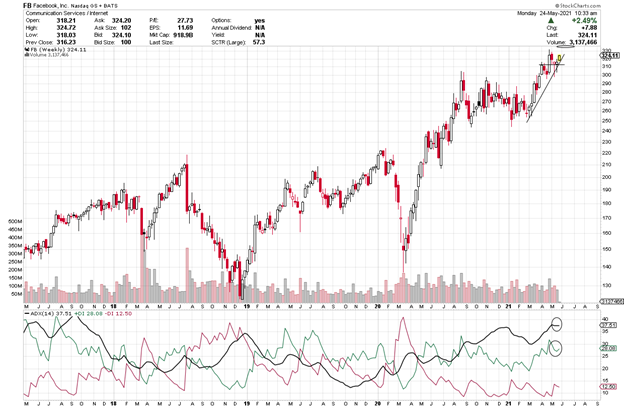
I looked through a lot of charts over the weekend. I zeroed in on FB because it had a modest pullback and now looks ready to recover and climb to new highs.
On the ADX indicator below the chart, notice how the green +DI line is above the red line and the black line may again turn up to show strength. These are all signals of strength with the thought that it may continue to climb.

Average Directional Index (ADX) Points to Direction and Strength
ADX is an easy indicator to interpret. The +DI line (green) is bullish and when it is on top, it suggests price is going to head up. When the -DI line (red) is on top, it suggests price is going to drop.
The black line is the strength line and when it heads up, it is telling you strength is moving into the DI line that is on top and in control. When the ADX line has been heading down, the DI line on top has been weakening and is ready for a change.
When the DI lines swap places and cross up and the ADX heads up, it suggests strength is moving into the new DI direction.
ADX signal = Profit Payout
Each candle on the chart represents price movement of a week. As the plus DI heads up and toward the black line and remains above the red line, it suggests there is bullish strength that could continue to grow, especially once the black line starts to turn up. If price continues to move up, the ADX line (black) will turn to head up to imply that strength will continue to support the trade. As long as the ADX is heading up, it means it is supporting the bullish- up direction.
I am looking at its chart and possible trade on Monday, but the pattern should hold. You don’t want to consider entry if the current candle were to drop below the line drawn on the chart. Think of it as dropping through a floor. If that happened, you would not enter or you would close the trade.
FB Potential Trade
Facebook (FB) started the week on a bullish note. Its pattern should remain intact as long as price keeps rising. Notice the plus DI is well above the -DI. We want the plus DI to remain above the -DI (green above the red) to consider a trade. Green line on top is bullish.
Price is likely to rise further and eventually above 325 for entry. Its first target is 345 as the plus DI (green line) moves up and the ADX (black line) rises. Its current uptrend should remain intact and price should continue to rise, perhaps even higher. We will keep an eye on FB over the course of the next couple weeks.
I am looking at charts on Monday, so prices are apt to change a little by Wednesday.
The short-term price target for FB is $340, then perhaps, higher.
To buy shares of FB today price would be approximately 325. If it reaches its near-term target of $345 that would be a rise of $20 or 6% profit in a short period of time. It you bought two shares the total cost would be $650, and you would earn $40 total on the two shares.
This said, option trading offers the potential of a smaller initial investment and higher percentage gain even when price is expected to rise. Let’s take a look.
If you bought one Call option contract covering 100 shares of FB’s stock with a July 16th expiration date for the $345 strike and premium would be approximately $5.55 today or a total of $555. If price decreased the expected $20 to $345 target over the next few weeks, the premium might increase approximately $20 to $25.55 per share or $2,555 on your 100 share contract. This is a gain of $2,000 on your $555 investment or a 360% gain.
Remember you can close an option trade anywhere along the line before expiration to take gains or stop a loss.
The example above is a comparison of an investment of $555 and a $2,000 gain versus a $650 investment and $40. Big difference.
Options can offer a win, win, win trade opportunity. They often offer a smaller overall investment, covering more shares of stock and potentially offer greater profits.
If you are having any kind of trouble taking advantage of these trades, I don’t want you to miss out. I have put together programs that help traders just like you access the potential profits that options provide. I write like we are having a conversation so the information is easy to understand and apply. Be sure to check out the programs shared in this email and we will make it easy for you to get your share.
I love to trade and I love to teach. It is my thing.

PS-I have created this daily letter to help you see the great potential you can realize by trading options. Being able to recognize these set ups are a key first step in generating wealth with options. Once you are in a trade, there is a huge range of tools that can be used to manage the many possibilities that can present themselves. If you are interested in learning how to apply these tools and increase the potential of each trade, click here to learn more.

Review of Past Candidates:
Seven weeks ago, we looked at First Solar (FSLR). Got off to a slow start. It has been down 3 weeks and is up this week a little. It is below its 100 strike and has until June 18th.
Six weeks ago, we studied Lowes (LOW). It rose to 215 well above its 210 target. It has been down the last two weeks and back up a little this week.
Five weeks, we covered Target (TGT). It is up this week to 228.01 well above 220 target. The premium when it was listed was 4.75 and it is now at $9.90. Awesome trade and it has until June 18th.
Four weeks ago, we looked at Silver ETF (SLV). It is at 25.82 and last week went as high as 26.39. It is above its 25 target and has until June before it expires.
Three weeks ago, we checked out Disney (DIS)- it is up this week after being down and its chart candles look flat. It’s at 147.37 with a target of 190 and has until June.
Two weeks ago, we examined MO. It started flat- three weeks at the 50.29 area. It has a 52.50 strike with a June 18th expiration date.
Last week, we looked at IWM, thinking it and the market as a whole may have dropped and slipped into a correction. IWM dropped as low as 214 with a 210 target and then climbed back up to the area above the line. It was a quick small trade and now looks undecided – up/down?


Recent Comments