
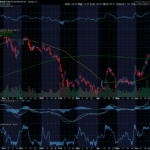
On the chart attached which is an hourly of the SPX, the week thus far is contained in the ellipse. As you can see we basically have had a week of not much. However one important thing has happened … by virtue of time passing in congestion the RSI oscillator has gone from extreme overbought, to potentially oversold if we see any weakness Friday.


The area I indicated I wanted to go long earlier this week is indicated by the rectangular ribbon around 4320’s in SPX. Reaching this price area could fit nicely into an oversold RSI on the hourly chart. One stock I like to buy here is Palantir PLTR. Nice uptrend, good earnings, looks like consolidation before a move above $20. Talk next week!
Thanks,
Joe


Recent Comments