
Built to spot reversals and confirm trend direction, this is a must have in your trading toolbox.
This week we are going to dive into the indicators I rely on to find, place, and manage trades to provide the greatest opportunity for profits.
Percentage Price Oscillator or PPO
Stockcharts.com provides a great definition of the Percentage Price Oscillator (PPO), which “is a momentum oscillator that measures the difference between two moving averages as a percentage of the larger moving average”. The Percentage Price Oscillator is shown with a signal line, a histogram, and a centerline. Signals are generated with signal line crossovers, center line crossovers, and divergences, or surprising differences.
The PPO reflects the convergence and divergence of two moving averages. PPO is positive when the shorter moving average is above the longer moving average. The indicator moves further into positive territory as the shorter moving average distances itself from the longer moving average. This reflects strong upside momentum.
The PPO is negative when the shorter moving average is below the longer moving average. Negative readings grow when the shorter moving average distances itself from the longer moving average (goes further negative). This reflects strong downside momentum.
The histogram represents the difference between PPO and its EMA, the signal line. The histogram is positive when PPO is above its EMA and negative when PPO is below its EMA. The PPO-Histogram can be used to anticipate signal line crossovers in the PPO.
I am setting the PPO at 13,21,8.

Let’s See Why This Signal Could Offer Potential Trade Info
Each candle on the chart represents price movement over a 5-day (week) period. The last couple week’s price on the chart above were mostly down. Next week’s candle will start with Monday’s price movement and then each consecutive day of the week will be added or subtracted to Monday’s number to create the weekly candle. We are always looking for the two lines to cross to give us a clear signal.
When we see a gap between moving averages it is often a sign of trend strength. PPO is a great way to spot that strength, and when it is about to change, at just a glance.
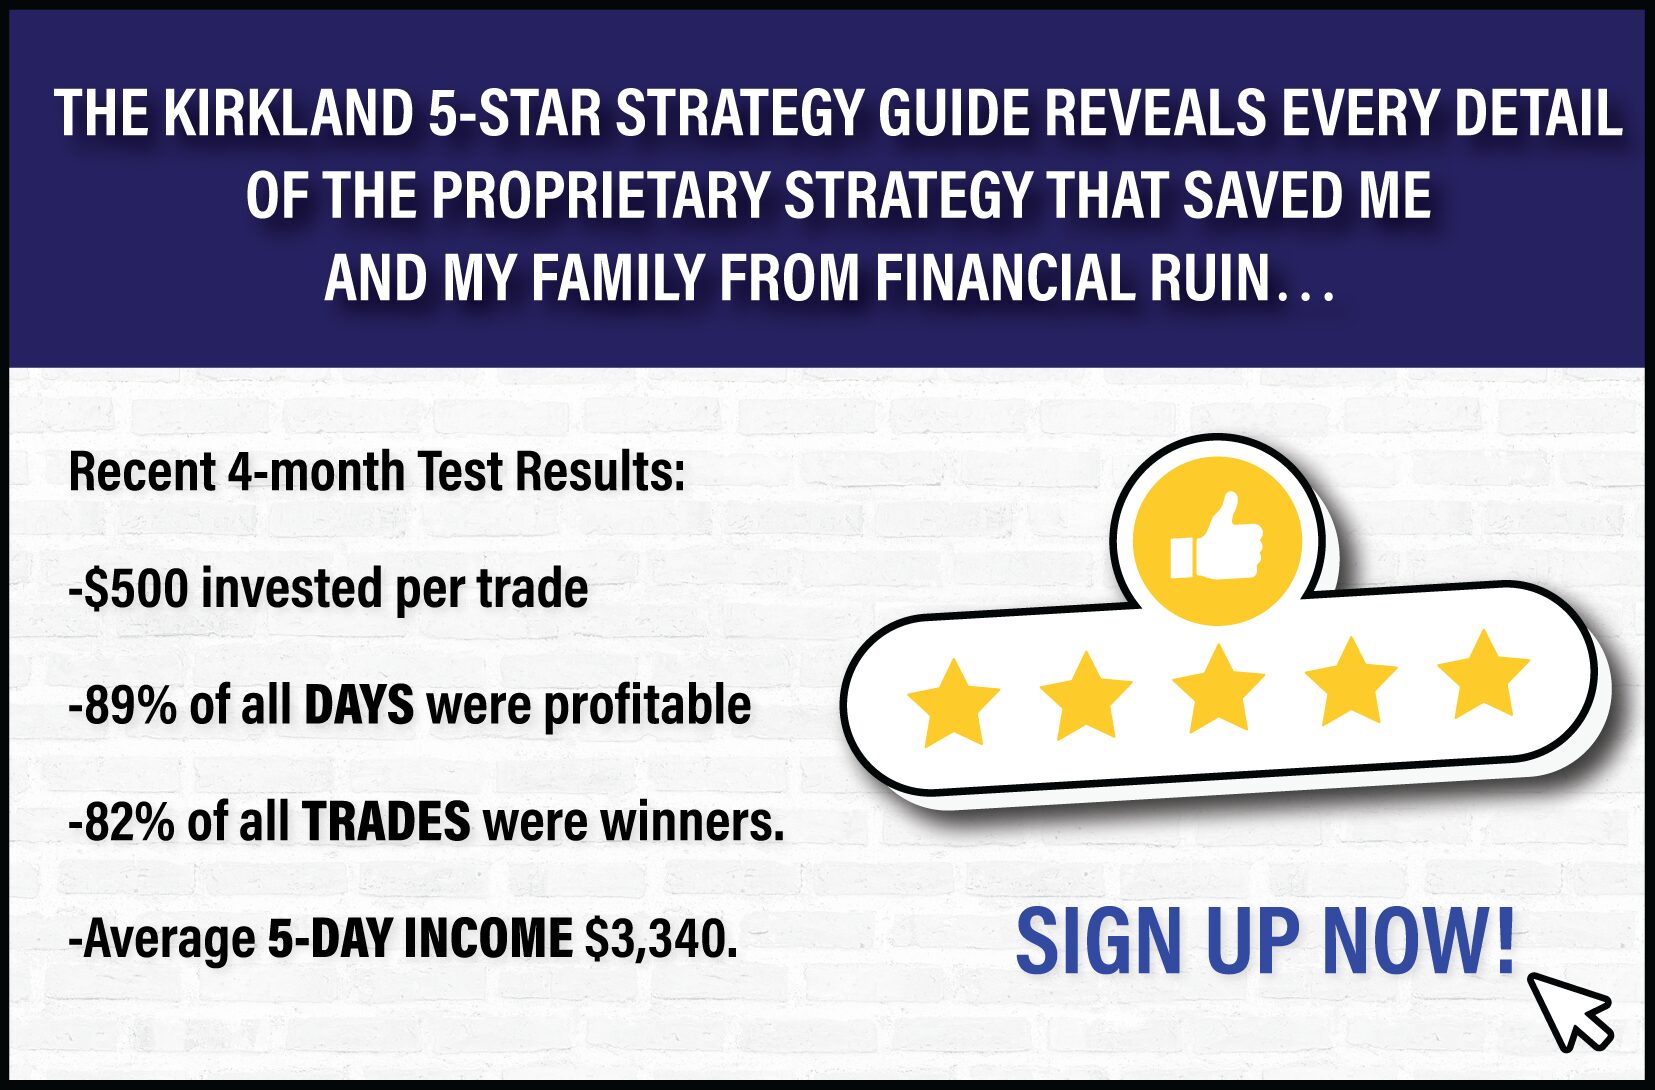
I hope you have enjoyed the review of these indicators this week. It is important to make sure you have a solid understanding of the top tools that can help you trade better. Even if you are seasoned pro, quick reviews like this are always a great way to strengthen your strategies and potentially increase your wins.
We dive into key trading fundamentals like this in my 5-Star Trading Academy. It is a great way to learn and since we do it with a group of great traders like yourself, it can make trading a lot of fun. To get more info, click here.
Yours for a prosperous future,
Wendy Kirkland


Recent Comments