
You can apply this trade strategy in various markets. Today, I spotted an excellent setup on my charts that grabbed my attention due to its track record of delivering successful trades. The standout feature was that it appeared on the DIA chart, the ETF that tracks the Dow Jones Industrial Average. The Dow is constantly in the spotlight, whether online, on TV, or in the news.
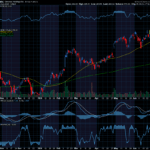
Take a look at this chart and pay attention to the RSI indicator at the bottom—it’s the key element of this setup.


The Relative Strength Index (RSI) is a powerful tool because it highlights overbought or oversold conditions, helping traders identify potential reversal points or continuation signals. (Learn more about RSI here). In this example it shows us BULLISH strength and a CALL option would be most effective.
What makes this exciting is that DIA is at $439.08 now and a move to 445 could equal a potential 41% return in a CALL option.
RSI is one of the tools I use to spot trades that I send out with specific instructions in my Diamond Paycheck Alerts program. If you are interested in getting these alerts, click here.
Whether the market is trending up or down, the RSI can help uncover hidden opportunities by signaling when a price may be poised for a pullback or breakout.
In a sideways or range-bound market, RSI can also indicate when the price is near the extremes of its recent range, offering potential trades in either direction. When there seems to be no clear trend, the RSI’s ability to identify these moments can give traders a significant edge. The key, of course, is knowing how to interpret the signals in the context of broader market conditions!
I’ll keep sharing more trading tools like these so keep an eye on your inbox.
I wish you the best,
Wendy


Recent Comments