

Big news on a cancer research drug has put this ticker on the radar of a lot of traders. It is showing up on the chart as it starts to show signs of setting up for a breakout. With the 300% launch that MRNA put on it’s chart back in august with a huge cancer breakthrough this ticker has everyone looking for a similar play.
Being able to spot these moves can often clue you in to a breakout before the headlines tell what is going on. Let’s take a look at the ticker and the chart.
Johnson & Johnson (JNJ) is gaining attention following encouraging developments in its oncology pipeline. The company recently announced promising clinical trial results for several cancer treatments, including an investigational prostate cancer therapy that achieved a 75% tumor response rate in an early-stage study. Additional findings showed a 77% response rate for a treatment being studied in advanced head and neck cancer, while results involving ERLEADA demonstrated a 62% reduction in the risk of recurrence or death among certain high-risk prostate cancer patients. Although further research is necessary, these developments highlight Johnson & Johnson’s expanding cancer treatment portfolio and its potential for long-term growth.
I use my P3 system to spot breakouts like this before they happen. If you want the full reveal of how it works and how you can use it on your own trading, click here.
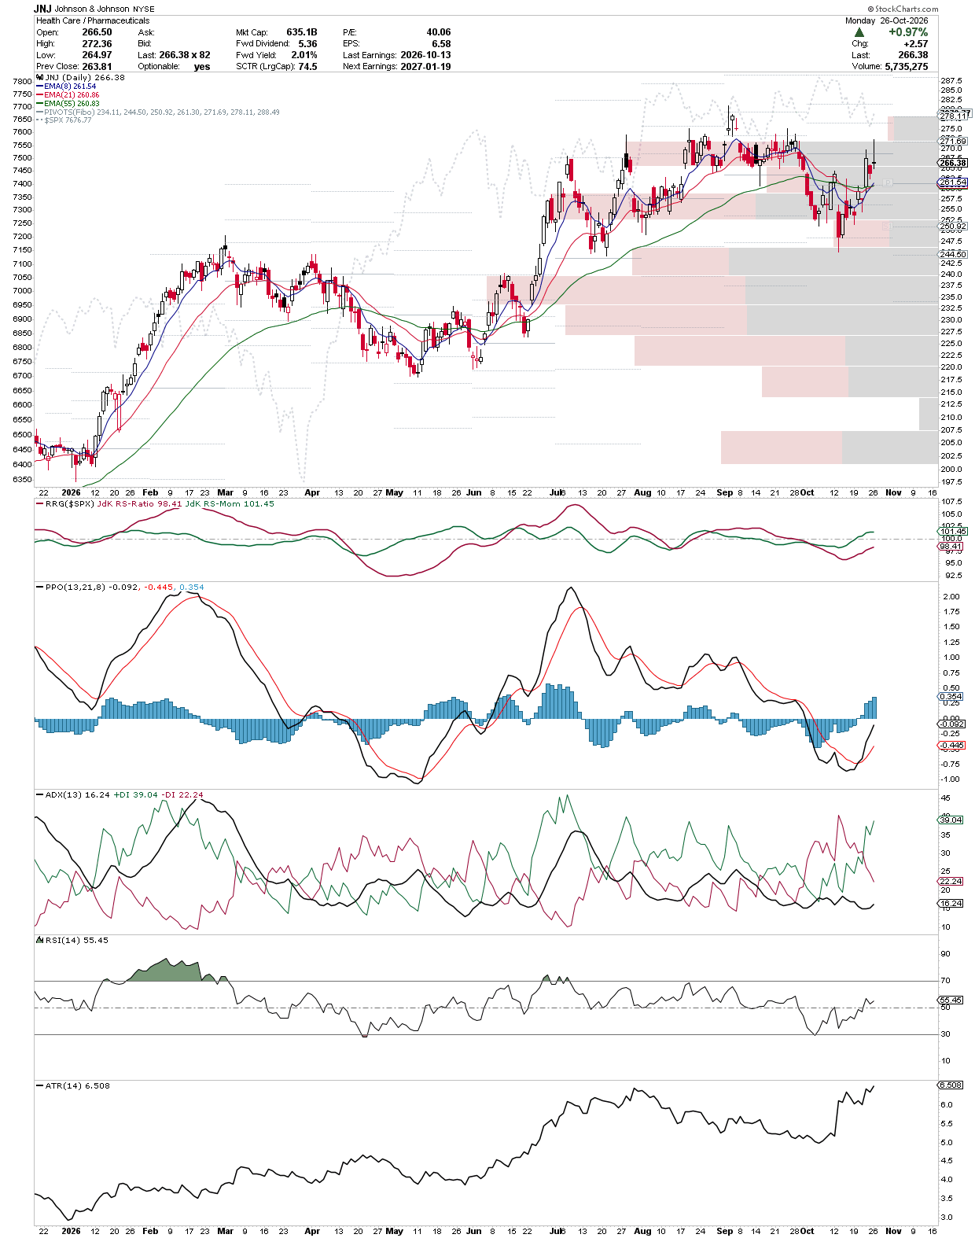
From a technical perspective, JNJ is showing signs of an emerging bullish reversal, with shares trading near $266.38 and moving back above the 8-, 21-, and 55-day exponential moving averages. The PPO is turning higher following a bullish crossover, while its improving histogram suggests strengthening upward momentum. The RSI near 55 leaves room for additional gains without indicating overbought conditions. Meanwhile, the positive directional indicator (+DI) at 39.04 is well above the negative directional indicator (−DI) at 22.24, suggesting buyers are gaining control. Although the ADX remains relatively low at 16.24, this is consistent with an early-stage trend that has not yet gained full strength. A sustained move above the $268–$270 resistance area could provide additional confirmation of a bullish continuation.
Wishing you the best,
Wendy










Recent Comments