
This clothing retailer stock is flashing a signal that could mean a 50% grab. Check it out below.
I teach everyday people (like me) to trade options. I do my best to write in an understandable way as if we are talking while sitting on my deck in a relaxed atmosphere.
The market was down 2 out of 5 days last week. I am typing this on Wednesday, and you won’t get this until Friday. A lot could change in a couple days.
Lululemon Put Potential
For today’s Trade of the Day, we will be looking at Lululemon (LULU).
Before analyzing LULU’s chart, let’s take a closer look at the company and its services.
lululemon athletica inc., together with its subsidiaries, designs, distributes, and retails athletic apparel and accessories for women and men. It operates in two segments, Company-Operated Stores and Direct to Consumer. The company offers pants, shorts, tops, and jackets for healthy lifestyle and athletic activities, such as yoga, running, and training, as well as other sweaty pursuits. It also provides fitness-related accessories and footwear. lululemon athletica inc. was founded in 1998 and is based in Vancouver, Canada.
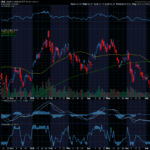
The chart of LULU below is a weekly chart with an ADX indicator at the bottom. The description coming up next explains how to use the ADX.
Average Direction Index (ADX) – Strength Indicator
The Average Directional Index consists of 3 lines: Green, Red and Black.
- Green = +DI (Bullish)
- Red = -DI (Bearish)
- Black = ADX Strength Line
The DI line that is on top is in control. If the ADX line is heading up, strength is supporting the DI line that is on top and in control.
Each candle on the chart represents price movement over a 5-day (week) period; therefore, it takes weeks for trades to play out. When the -DI crosses over the +DI line, it gives a buy signal for Puts as the -DI line (red) appears as if it is in control and rising to head up on the ADX indicator, and as the ADX turns up that is even more bearish, suggesting a downward move is gaining strength. When the +DI (green line) crosses the red and the black line points up it shows an upward trend and Calls can be considered.
Let’s look at LULU’s weekly chart.


The ADX -DI (red line) is close to crossing the +DI and the black ADX line is curling up. As long as the -DI is above the +DI, price should fall. The past several weekly candles are negative. If you want to learn more about ADX, read on or, if not, scroll down to the alert.
Potential LULU Trade – Showing Strength
This signal could give a quick payout if it continues its downward move, and the strength of this pattern continues. I am typing this on Wednesday, and LULU costs about $260.86. If LULU’s price moves below $260 and the – DI (red line) is above the +DI, and the black line is heading up, you could consider a Put trade. The short-term price target for LULU is $250 and then, perhaps, lower. With the swings in past months, I am suggesting small profit targets until a market trend starts again.
Check Out How an Option Trade Could Pay Out Big Time
Option trading offers the potential of a lower initial investment and higher percentage gain. Let’s take a look and make a comparison.
If you bought 1 stock share of LULU, it would cost about $260.86. You would wait until it hit a bottom before you bought stock.
If you bought 1 Put option covering 100 shares of LULU with a June 17th expiration date for the 240 strike, the premium would be approximately $ 10.00 today, or $1000 for 1 option. If price fell to $10 over the next few weeks, the premium would likely increase $5, giving $500 profit on your $1000 investment. This is a 50% gain.
Trading options is a win, win, win opportunity. Options often offer a smaller overall investment, covering more shares of stock and potential for greater profits.
I like to stress when trading options, you don’t need to wait for the expiration date to close the trade. You can close anywhere along the way prior to the expiration date. It is never a bad idea to take profit.
Trading options is like renting stocks for a fixed period of time. The potential to generate steady income with options is real, and it can be transforming.
Routinely remind yourself – I believe in myself and my ability to succeed. I believe in an abundance of unlimited possibilities. The future will be awesome!
I wish you the very best,
Wendy

Past potential trade update:
Last week we discussed buying NEM 55 Puts with a June 17th expiration date. The stock price did not reach our target entry. No trade would be taken.


Recent Comments