The CCI indicates a potential 194% profit on ABBV stock. Continue reading and I’ll explain.
Happy Wonderful Wednesday!
Last week, the Dow Jones was down 3 out of 5 days. The Nasdaq was also down, and it looks like it has further to go before it hits a bottom. We will look at Puts.
AbbVie On the Move
For today’s Trade of the Day, we will be looking at AbbVie, Inc. symbol (ABBV).
Before analyzing ABBV’s chart, let’s take a closer look at the stock and its services.
AbbVie Inc. discovers, develops, manufactures, and sells pharmaceuticals in the worldwide. The company was incorporated in 2012 and is headquartered in North Chicago, Illinois.
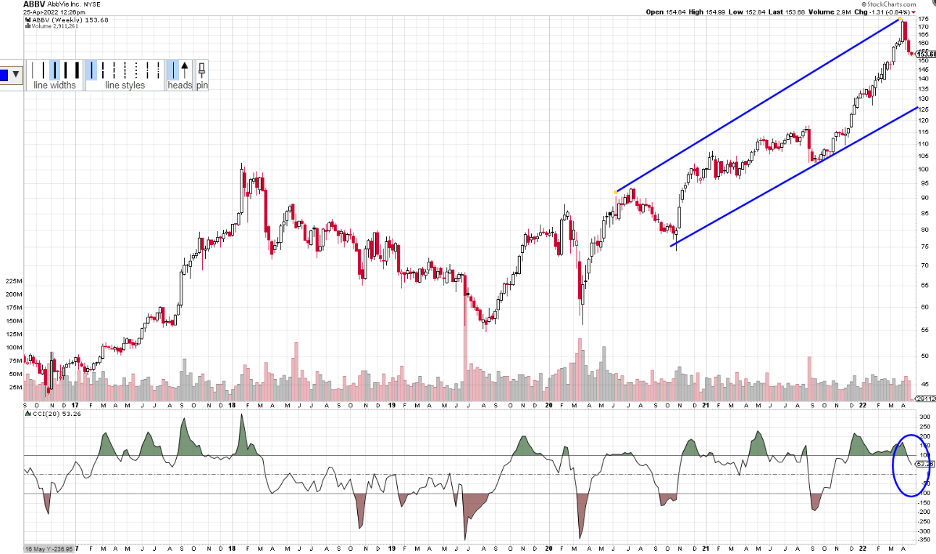
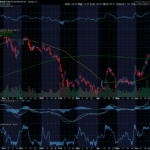
The chart of ABBV below is a weekly chart with a CCI indicator at the bottom. The description coming up next explains how to use the CCI.
Channel Commodity Index
Stockcharts.com provides a great definition of the Commodity Channel Index (CCI), which is a versatile indicator that can be used to identify a new trend or warn of extreme conditions. Originally, it was developed to identify cyclical turns in commodities, but the indicator can be successfully applied to indices, ETFs, stocks and other securities. In general, CCI measures the current price level relative to an average price level over a given period.
CCI is relatively high when prices are far above their average but is relatively low when prices are far below their average. In this manner, CCI can be used to identify overbought and oversold levels or breaks from one level to another.
A move down to the CCI -100 or the zero line can issue a Put entry signal as it moves from being bullish to bearish. A move toward -100 is a continuation of that bearishness. Up through the 100 line creates a green fin of bullishness until it drops back down through the -100 line.
A break below the zero line means it has gone from bullish to bearish and a drop below -100 suggests even more bearishness.
ABBV’s Potential Trade
Please note and remember that I am typing this on Monday, two days before you receive it. The information I am sharing could change over those two days and is intended to share the opportunities that options offer us.
AbbVie (ABBV) has been heading down for a week. We want the CCI will turn drop to create a lower fin shape. We also want the price to go down to at least $153 before entering a trade. The first target would be $145.
Check Out How an Option Trade Could Pay Out Big Time
To buy stock shares of ABBV today, price would be approximately $154. You would not buy stock when you are expecting the price to go down. You would wait until if found a bottom.
This said, option trading offers the potential of a smaller initial investment and higher percentage gain even when price is expected to rise or fall. Let’s take a look.
If you bought one Put option contract covering 100 shares of ABBV’s stock with a May 20th (May 22=monthly expiration) expiration date for the $145 strike premium would be approximately $2.06 today, or a total of $206 per contract. If price fell the expected $8, the premium might increase approximately $4.00 to $6.06 per share on your 100-share contract. This is a 194% gain over a couple weeks.
For updates on previous potential trades we have discussed, scroll to the bottom of this message.
Remember you can close an option trade anywhere along the line before expiration to take gains or stop a loss.
Options can offer a win, win, win trade opportunity. They often offer a smaller overall investment, covering more shares of stock, and potentially offer greater profits.
I love to trade, and I love to teach. It is my thing.
Yours for a prosperous future,
Wendy Kirkland
PS – I have created this daily letter to help you see the great potential you can realize by trading options. Being able to recognize these set ups are a key first step in generating wealth with options. Once you are in a trade, there is a huge range of tools that can be used to manage the many possibilities that can present themselves throughout the trade to earn and take profit or prevent a loss. Lots of fun things to learn and fine-tune.


Recent Comments