
There is a potential 73% put trade we just spotted. Check it out.
Last week, the Dow Jones was down 1 out of 5 days. The Nasdaq was also down, and it looks like it has further to go before it hits a bottom. We will look at Puts.
GameStop Corp. Pullback Could Mean Put Profits
For today’s Trade of the Day, we will be looking at GameStop Corp. symbol (GME).
Before analyzing GME’s chart, let’s take a closer look at the stock and its services.
GameStop Corp., a specialty retailer, provides games and entertainment products through its e-commerce properties and various stores in the United States, Canada, Australia, and Europe. The company sells new and pre-owned gaming platforms; accessories, such as controllers, gaming headsets, virtual reality products, and memory cards; new and pre-owned gaming software; and in-game digital currency, digital downloadable content, and full-game downloads. It also sells collectibles comprising licensed merchandise primarily related to the gaming, television, and movie industries, as well as pop culture themes. As of January 29, 2022, the company operated 4,573 stores and ecommerce sites under the GameStop, EB Games, and Micromania brands; and 50 pop culture themed stores that sell collectibles, apparel, gadgets, electronics, toys, and other retail products under the Zing Pop Culture brand, as well as offers Game Informer, a print and digital video game publication featuring reviews of new releases, previews of the big titles on the horizon, and coverage of the latest developments in the gaming industry. The company was formerly known as GSC Holdings Corp. GameStop Corp. was founded in 1996 and is headquartered in Grapevine, Texas.
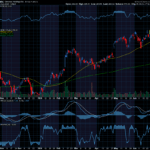
The chart of GME below is a weekly chart with a CCI indicator at the bottom. The description coming up next explains how to use the CCI.
Channel Commodity Index
Stockcharts.com provides a great definition of the Commodity Channel Index (CCI), which is a versatile indicator that can be used to identify a new trend or warn of extreme conditions. Originally, it was developed to identify cyclical turns in commodities, but the indicator can be successfully applied to indices, ETFs, stocks and other securities. In general, CCI measures the current price level relative to an average price level over a given period.
CCI is relatively high when prices are far above their average but is relatively low when prices are far below their average. In this manner, CCI can be used to identify overbought and oversold levels or breaks from one level to another.
A move down to the CCI -100 or the zero line can issue a Put entry signal as it moves from being bullish to bearish. A move toward -100 is a continuation of that bearishness. Up through the 100 line creates a green fin of bullishness until it drops back down through the -100 line.
A break below the zero line means it has gone from bullish to bearish and a drop below -100 suggests even more bearishness.


On the CCI indicator below the GME chart, notice how the line is has crossed the zero-line going into bearish territory. This signals bearish moves with the thought that price may move down.
GME’s Potential Trade
Please note and remember that I am typing this on Monday, two days before you receive it. The information I am sharing could change over those two days and is intended to share the opportunities that options offer us.
GameStop (GME) has been heading down for weeks. We want the CCI to drop to create a lower fin shape. We also want the price to go down to at least $91 before entering a trade. The first target would be $80
Check Out How an Option Trade Could Pay Out Big Time
To buy stock shares of GME today, price would be approximately $92. You would not buy stock when you are expecting the price to go down. You would wait until if found a bottom.
This said, option trading offers the potential of a smaller initial investment and higher percentage gain even when price is expected to rise or fall. Let’s take a look.
If you bought one Put option contract covering 100 shares of GME’s stock with a June 17th expiration date for the $70 strike premium would be approximately $6.15 today, or a total of $615 per contract. If price fell the expected $9, the premium might increase approximately $4.50 to $10.65 per share on your 100-share contract. This is a 73% gain over a couple weeks.
For updates on previous potential trades we have discussed, scroll to the bottom of this message.
Remember you can close an option trade anywhere along the line before expiration to take gains or stop a loss.
Options can offer a win, win, win trade opportunity. They often offer a smaller overall investment, covering more shares of stock, and potentially offer greater profits.
I love to trade, and I love to teach. It is my thing.
I wish you the very best,
Wendy
PS – I have created this daily letter to help you see the great potential you can realize by trading options. Being able to recognize these set ups are a key first step in generating wealth with options. Once you are in a trade, there is a huge range of tools that can be used to manage the many possibilities that can present themselves throughout the trade to earn and take profit or prevent a loss. Lots of fun things to learn and fine-tune.
Past potential trade update:
Two weeks ago we discussed buying ATVI 75 Puts with a May 20th expiration date. It did not reach the target entry price.


Recent Comments