
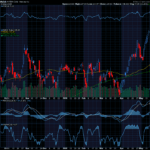
As the attached chart illustrates, we are concluding the 12th green candlestick out of the last 14 on the monthly chart. And one of the 2 red monthly candles was barely red. What does that mean? Well, in my view it gives us big picture context. In trading it is always important to keep the bigger picture in mind. If you focus only on small time frames you will get run over by the larger trend which is usually much more important and powerful. Now it is certainly possible (because anything is possible in the stock market) we get 13 out of 15 green monthly candles. It is not enough of a reason by itself to go hog wild short. It is most certainly enough of a reason though to stay out of the long side.

At this point I believe almost everyone is in the pool. I read the other day that the percentage of people that believe the market will be higher in a year is at all time highs (not sure how back that data goes). It does feel a bit like 1999 -2000 in the Nasdaq though. Any of the upside from here will be a short squeeze in my view. As such a quick acceleration higher cant be ruled out as the last shorts are squeezed. However a rug pull is coming.
My positions are short via February 2025 puts in Google at 169.50 (close 170.50) and long June and Sept 2025 calls in TLT from 94.50 (close 94.00). I can always write shorter term options against those positions and often/usually do to defray my costs.
Thanks,
Joe


Recent Comments