

The energy boom is real and it is creating some great chart patterns.
The modern world’s insatiable hunger for energy is driving an unprecedented boom in natural gas infrastructure to power AI data centers and global exports. At the heart of this structural shift is one midstream powerhouse quietly expanding its empire with multi-billion-dollar acquisitions and massive new pipeline expansions. While long-term, fee-based revenues secure its fundamental outlook, a sudden surge in buying momentum indicates Wall Street is racing to pile into the stock right now. To uncover the identity of this explosive energy giant and see the precise technical indicators triggering a massive breakout signal, take a close look at the chart below.
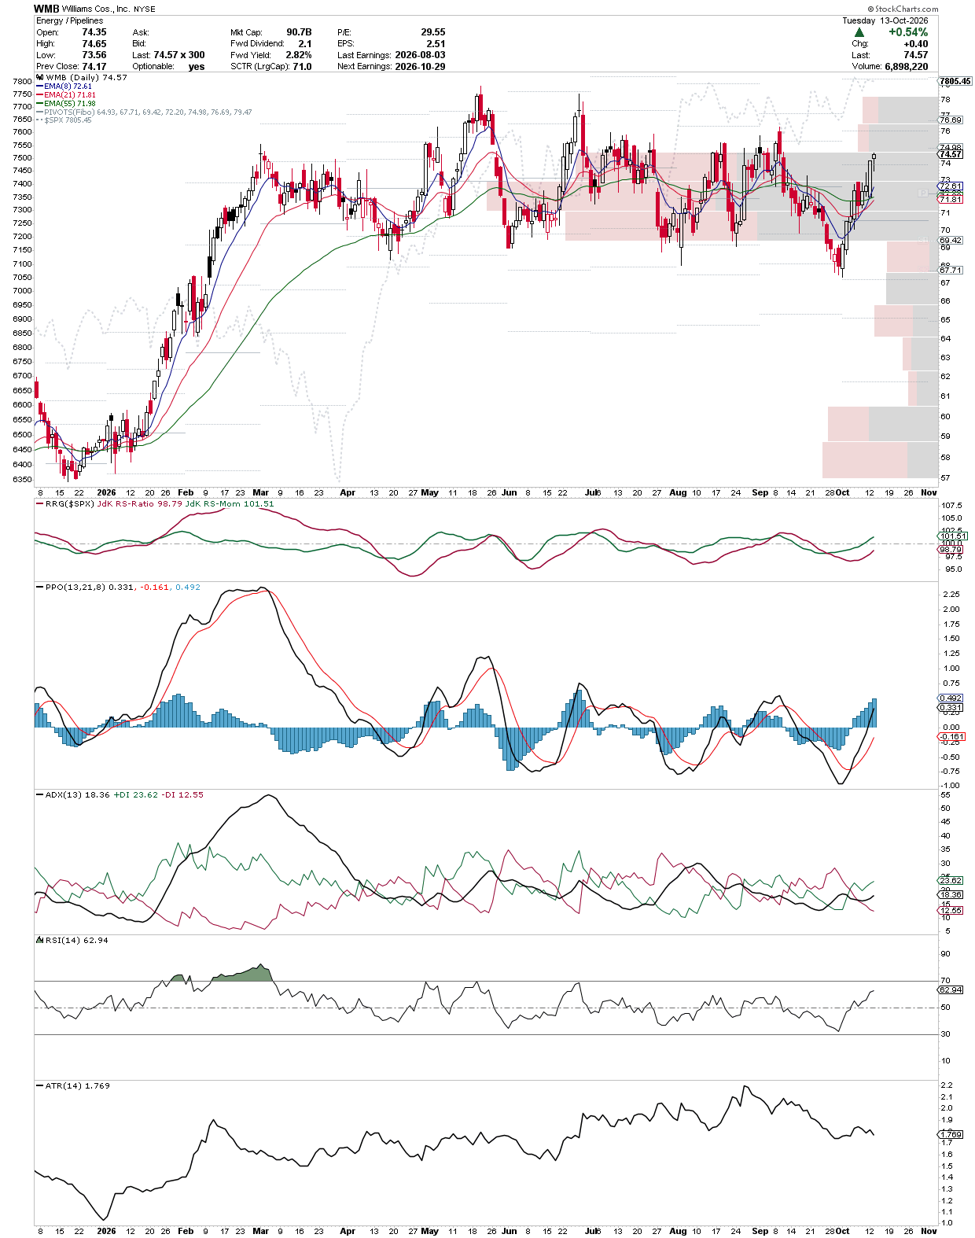
Williams Companies (WMB) continues to strengthen its position in the natural gas infrastructure market as demand grows from LNG exports, power generation, and expanding energy-intensive industries. Recent attention has focused on the company’s Shelby Connector and Delta Access pipeline expansion projects, which are designed to increase natural gas transportation capacity from the Western Haynesville region to Gulf Coast LNG facilities and power customers. These projects complement Williams’ recently completed $5.5 billion acquisition of Momentum Midstream, which added more than 4,000 miles of pipeline infrastructure and expanded its access to growing natural gas markets. Together, these investments position Williams to benefit from increasing demand for reliable energy infrastructure while expanding its long-term, fee-based revenue opportunities.
WMB is showing renewed bullish momentum following a rebound from its recent lows near $67. Shares have climbed above the 8-day, 21-day, and 55-day exponential moving averages, with the shorter averages beginning to turn higher. The PPO has crossed above its signal line and moved into positive territory, while the RSI at 62.94 indicates strengthening buying pressure without reaching overbought levels. The positive directional indicator at 23.62 is also well above the negative indicator at 12.55, supporting the bullish outlook. Although the ADX reading of 18.36 indicates that the developing trend has not yet established significant strength, continued buying pressure could push shares toward resistance around $74.98, followed by the $76.69 area. A sustained breakout above these levels would provide further confirmation of the bullish reversal.
Wishing you the best,
Wendy











Recent Comments