
In the first attached chart of the SPX we can see the zone I have been discussing for weeks is still in place. Though it looks very likely at this point that any stop losses above that are going to get wiped out. The chart is one I would always follow, and I don’t have an issue with that decision.
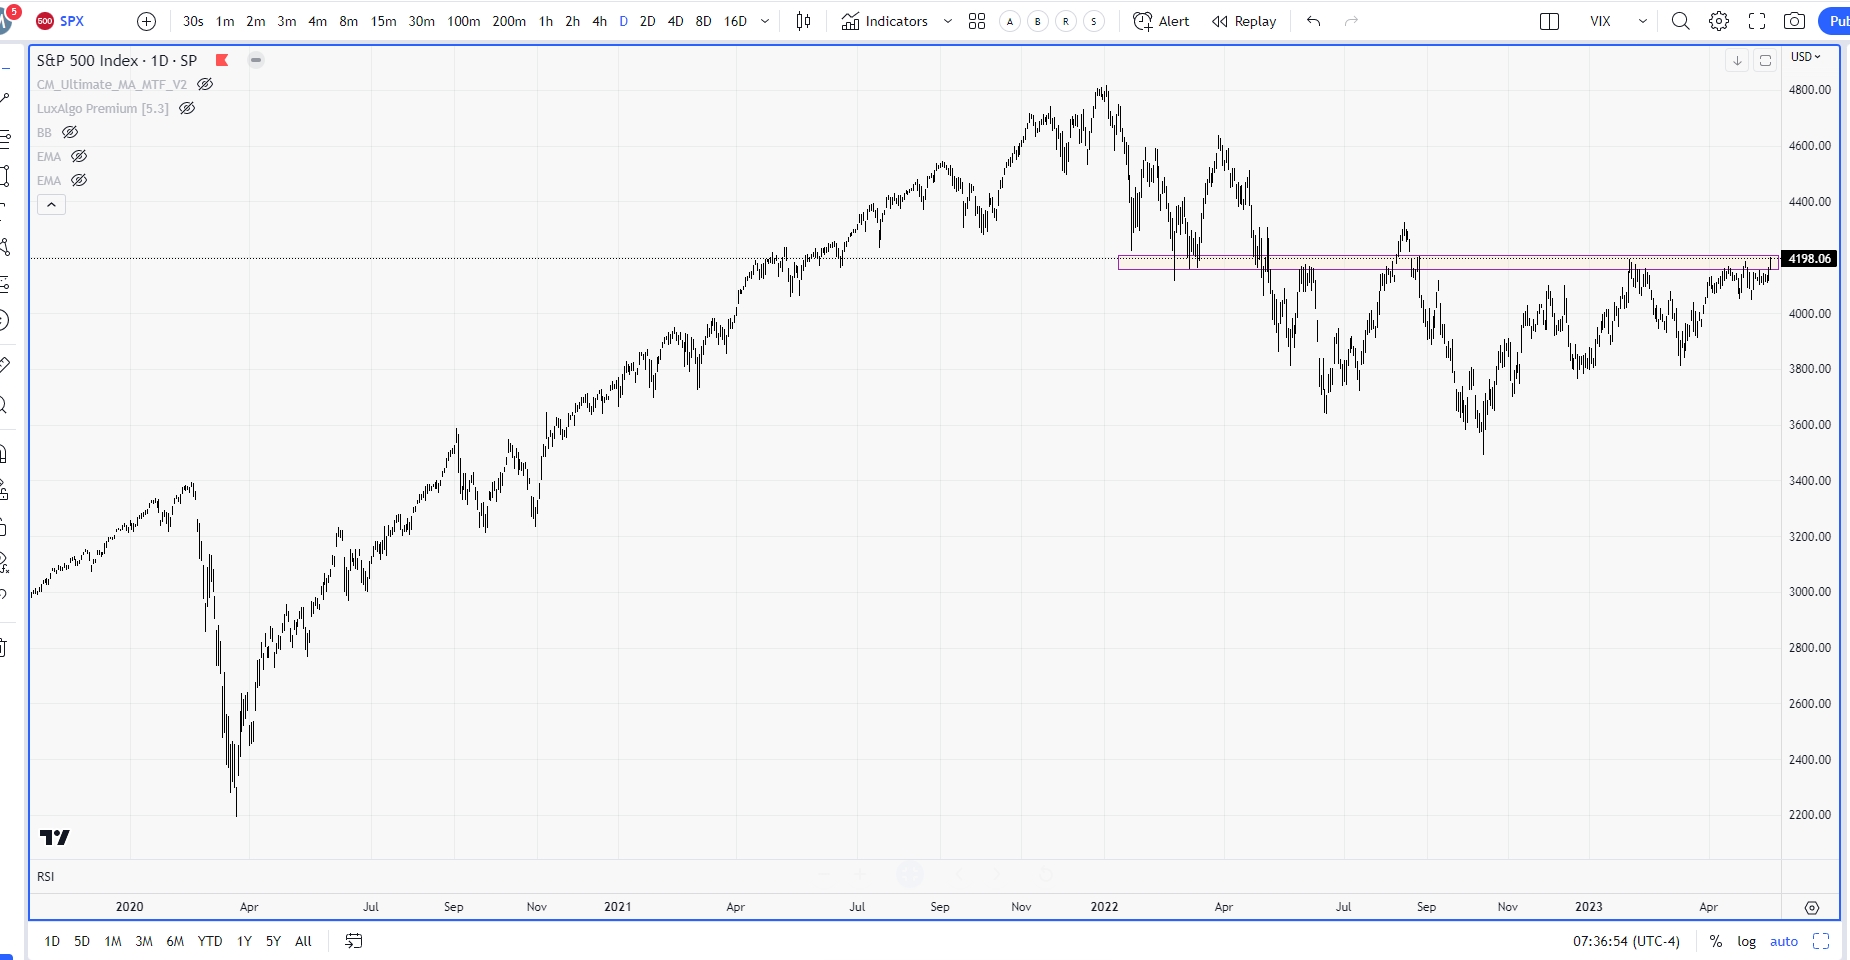

This period has been a learning one for all of us because the market is rapidly changing— and it has been rapidly changing over the past two or three years — due to many factors, algos and particularly options, have become a huge influence. Derivatives are no longer derivatives… the tail is wagging the dog now, as option positioning is determining the direction of the underlying. It has caused stocks to decouple from fundamentals— the PE of the SP 500 is higher now at SPX 420 then it was when SPX was 480.
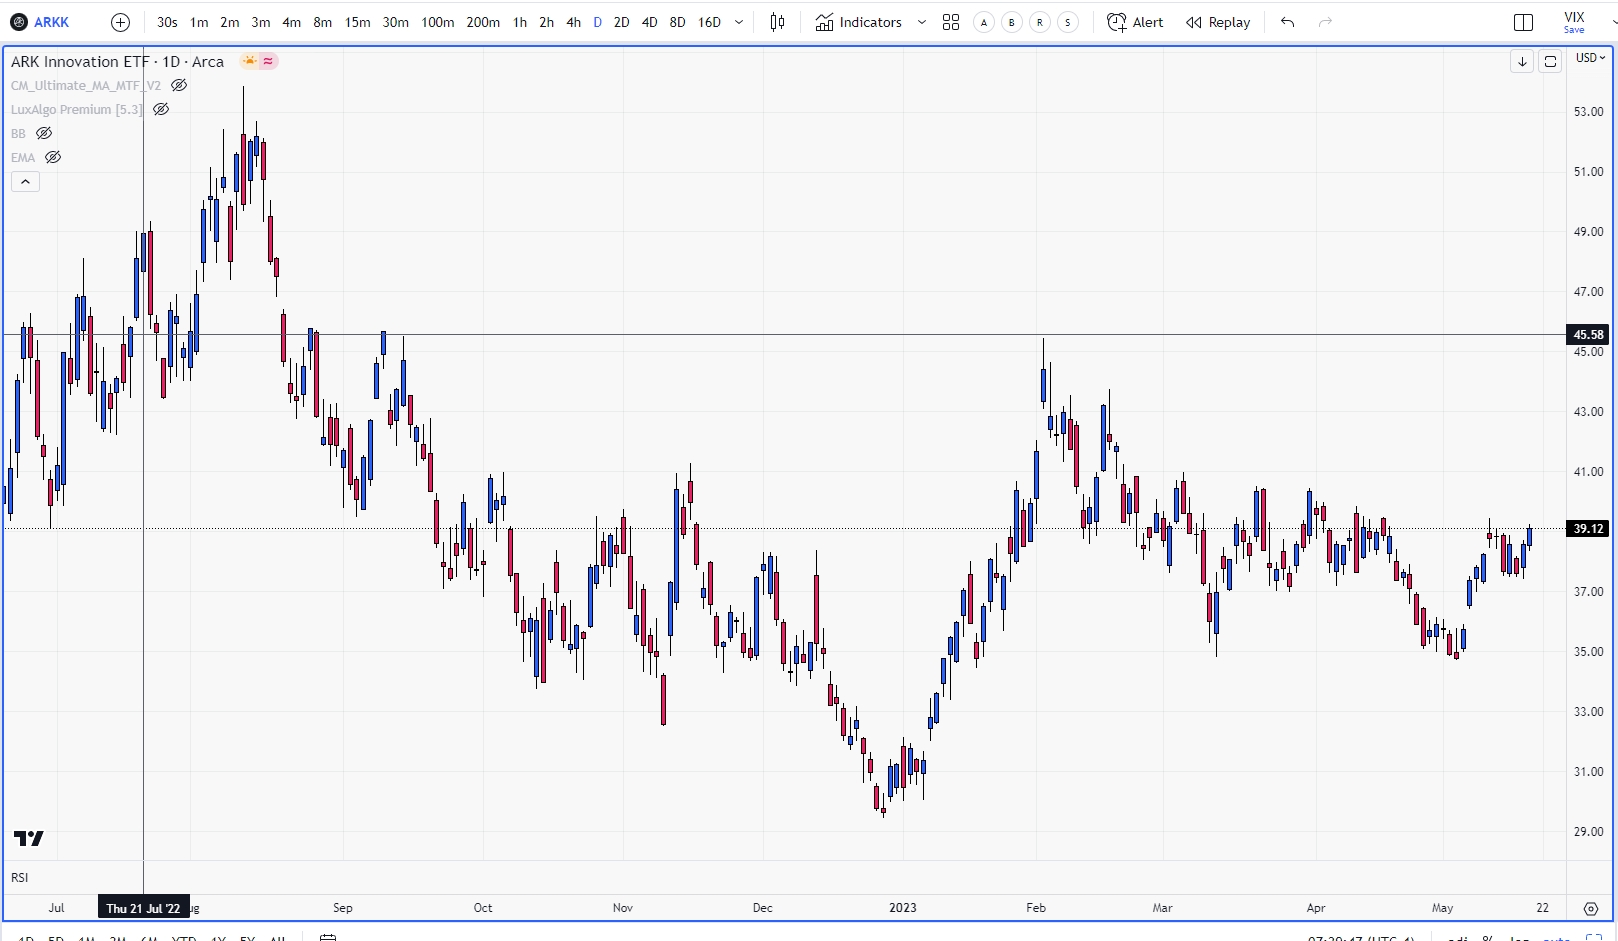
The biggest thing to look for now— and when I say big I mean it. We want to see if when the handful of tech stocks that have held the average up start to wane do we rotate in the next tier. So two things to look for here. First stocks like ARKK innovation ETF. It’s in a “cup and handle” on the attached chart, if it starts to perform from here then the market is rotating and wants higher. The second big clue is the NDX IWM spread. If the IWM, which has been badly underperforming the NDX , starts to outperform the NDX, the market wants higher. Watch these two for clues.
Thanks,
Joe


Recent Comments