
Dear Reader,
Yesterday, we looked at a Daily Price Chart of HSBC Holdings PLC noting the stock’s OBV line is sloping up validating its bullish trend.
For today’s Trade of the Day we will be looking at a Keltner Channel chart for Arch Capital Group Ltd. stock symbol: ACGL.
Before breaking down ACGL’s daily Keltner Channel chart let’s first review which products and services are offered by the company.
Arch Capital Group Ltd., together with its subsidiaries, provides insurance, reinsurance, and mortgage insurance products worldwide. The company’s Insurance segment offers primary and excess casualty coverages; loss sensitive primary casualty insurance programs; collateral protection, debt cancellation, and service contract reimbursement products; directors’ and officers’ liability, errors and omissions liability, employment practices and fiduciary liability, crime, professional indemnity, and other financial related coverages.
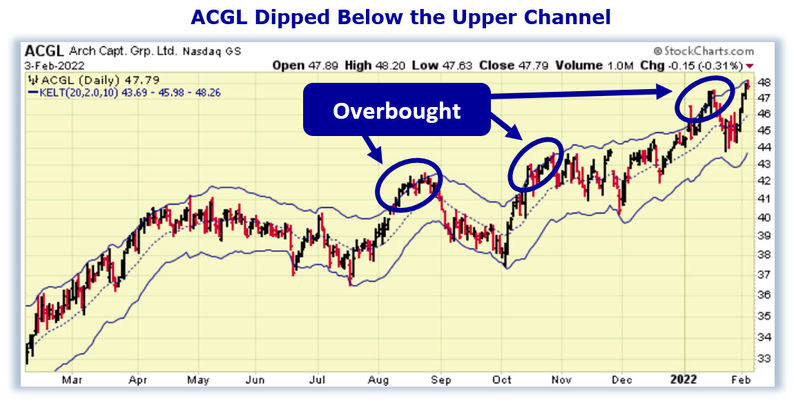
Now, let’s begin to break down the Keltner Channel chart for ACGL. Below is a Daily Price Chart and the three Keltner Channels for ACGL stock.
Buy ACGL Stock
The Hughes Optioneering Team uses the Keltner Channels as an indicator to determine whether a stock is overbought or oversold. If a stock’s daily stock price is trading above the upper Keltner Channel, this signals that the stock is temporarily overbought and subject to a retracement.
Even stocks that are in the strongest bull trends do not advance in a straight line. There are always price retracements along the way. When a stock becomes overbought, it’s price will typically decline soon after as the inevitable profit taking occurs.
The ACGL daily price chart shows that the stock is in a strong price uptrend and has become overbought several times. You can see this as ACGL has traded above the Upper Keltner Channel on multiple occasions recently.
But, in every scenario when ACGL became overbought, the stock soon experienced a pullback.
Finding opportunities when a stock experiences a pullback is why the Hughes Optioneering Team uses the Keltner Channels. They help us find a lower-risk entry point.
The Keltner Channel “Buy Zone” occurs when a stock is trading below the upper Keltner Channel. Once the daily price is trading below the upper channel, it provides a lower-risk buying opportunity as the stock is likely to rally.
Our initial price target for ACGL stock is 54.45 per share.
Profit if ACGL is Up, Down or Flat
Now, since ACGL is trading in the Keltner Channel ‘Buy Zone’ this offers a prime trade entry opportunity. Let’s use the Hughes Optioneering calculator to look at the potential returns for an ACGL call option spread.
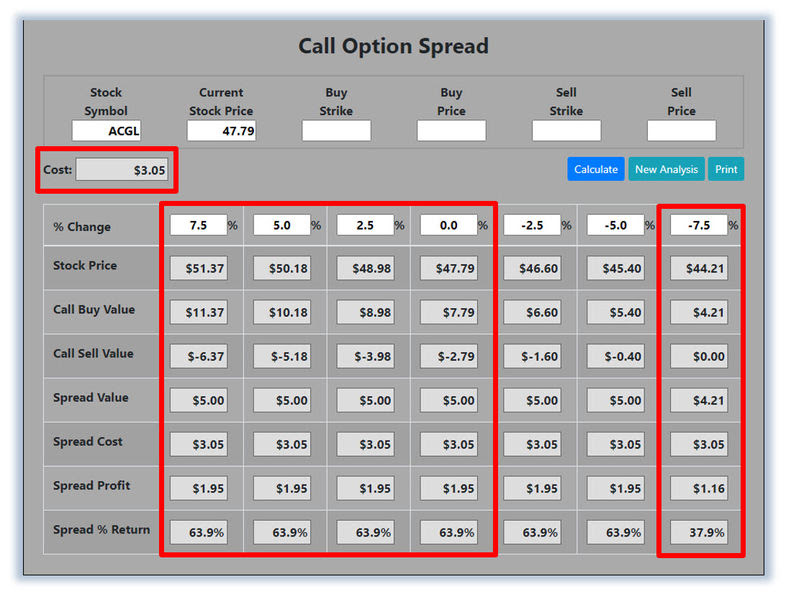
The Call Option Spread Calculator will calculate the profit/loss potential for a call option spread based on the price change of the underlying stock/ETF at option expiration in this example from a 7.5% increase to a 7.5% decrease in ACGL stock at option expiration.
The goal of this example is to demonstrate the ‘built in’ profit potential for option spreads and the ability of spreads to profit if the underlying stock is up, down or flat at option expiration. Out of fairness to our paid option service subscribers we don’t list the option strike prices used in the profit/loss calculation.
The prices and returns represented below were calculated based on the current stock and option pricing for ACGL on 2/3/2022 before commissions.
Built in Profit Potential
For this option spread, the calculator analysis below reveals the cost of the spread is $305 (circled). The maximum risk for an option spread is the cost of the spread.
The analysis reveals that if ACGL stock is flat or up at all at expiration the spread will realize a 63.9% return (circled).
And if ACGL stock decreases 7.5% at option expiration, the option spread would make a 37.9% return (circled).
Option spread trades can result in a higher percentage of winning trades compared to a directional option trade if you can profit when the underlying stock/ETF is up, down or flat.
A higher percentage of winning trades can give you the discipline needed to become a successful trader.
The Hughes Optioneering Team is here to help you identify winning trades just like this one.
Interested in accessing the Optioneering Calculators? Join one of Chuck’s Trading Services for unlimited access! The Optioneering Team has option calculators for six different option strategies that allow you to calculate the profit potential for an option trade before you take the trade.
Get Started with the Weekly Option Alert!
Do you want to start receiving hand-picked trades from 10-Time Trading Champion, Chuck Hughes? The first step is simple!
As a Trade of the Day subscriber, Chuck is offering you a special discount on his Weekly Option Alert Trading Service.

Click the button to learn more and use the code “Optioneering VIP” to receive special pricing!
Wishing You the Best in Investing Success,

Chuck Hughes
Editor, Trade of the Day
Have any questions? Email us at dailytrade@chuckstod.com
DISCLAIMER: The information provided by the Legacy Publishing LLC (“Legacy”) Trading Services, newsletters and educational publications (“Services”) is not customized or personalized to any particular risk profile or tolerance. Nor is the information published by Legacy a customized or personalized recommendation to buy, sell, hold, or invest in particular financial products. Past performance is not necessarily indicative of future results. Please note that results may not be typical and can vary from person to person. There are inherent risks involved with investing in the stock and options market, including the loss of your investment. Any investment is at your own risk. You should only trade or invest your “risk capital” – money you can afford to lose. Trading stocks and stock options involves high risk, and you can lose the entire principal amount invested or more. There is no guarantee that systems, indicators, or trading signals will result in profits or that they will not produce losses. Chuck Hughes’ profit results are not typical. Chuck Hughes is an experienced investor, and your results will vary depending on risk tolerance, amount of risk capital utilized, size of trading position, willingness to follow the rules and other factors. The actual profit results presented here may vary with the actual profit results presented in other Legacy publications due to the different strategies and time frames presented in other publications. Trading on margin carries a high level of risk and may not be suitable for all investors. Other than the refund policy detailed elsewhere, Legacy does not make any guarantee or other promise as to any results that may be obtained from using the Services. Open trade profit snapshots of Chuck Hughes’ trading accounts represent the open trade profit performance for the trade(s) or the portfolio displayed on the day the snapshot was taken. Open trade profits may have increased or decreased when trades were closed out. Other strategies may not have been profitable during the same time period the open trade profits were displayed. In order to avoid a conflict of interest, Trading Service recommendations were not executed by Chuck Hughes or his associates. The trade entry and exit prices (and resulting profit/loss) represent the price of the security at the time the recommendation was disseminated. Trading Service profits are not based on actual trades and have certain limitations. Because the Trading Service trades have not actually been executed, the results may understate or overstate the impact of certain market factors, such as lack of liquidity. Also, the Trading Service results do not include the costs of subscriptions, commissions, or other fees. No representation is being made that you will achieve profits or the same results as any person providing a testimonial. Testimonials may relate to various other products offered by Legacy Publishing and not the product offered here, but all of these products are based on Chuck Hughes’ system. Performance results of other products described in such testimonials may be different from results for the product being offered and may have been achieved before the product being offered was developed. Results described in testimonials from other products or the product being offered may not be typical or representative of results achieved by other users of such products. No representation is being made that any of the persons who provide testimonials have continued to experience the same level of profitable trading after the date on which the testimonial was provided. In fact, such persons may have experienced losses thereafter or may have experienced losses preceding the period of time referenced in the testimonial. Cash Payout trades receive cash credits from the sale of option premiums. The net profits for Cash Payout trades may be less than the cash received for the sale of the option premium. Some cash income figures presented represent the total amount of option premium collected during the referenced period. Actual profits were less. Auto-trading, or any broker or advisor-directed type of trading, is not supported or endorsed by Legacy Publishing LLC. For additional information on auto-trading, you may visit the SEC’s website: All About Auto-Trading, https://www.sec.gov/reportspubs/investor-publications/investorpubsautotradinghtm.html


Recent Comments