Dear Reader,
Yesterday, we looked at a Monthly Price Chart of AmerisourceBergen Corp., noting the stock’s 1-Month Price is trading above the 10-month SMA signaling a ‘Buy’.
For today’s Trade of the Day we will be looking at an On Balance Volume chart for HSBC Holdings PLC stock symbol: HSBC.
Before breaking down HSBC’s OBV chart let’s first review which products and services are offered by the company.
HSBC Holdings plc provides banking and financial services worldwide. The company operates through Wealth and Personal Banking, Commercial Banking, and Global Banking and Markets segments. The Wealth and Personal Banking segment offers retail banking products and services, including current and savings accounts, mortgages and personal loans, credit and debit cards, and local and international payment services for ultra high net worth individuals; and wealth management services comprising insurance and investment products, global asset management services, investment management, and private wealth solutions.
Confirming a Price Uptrend with OBV
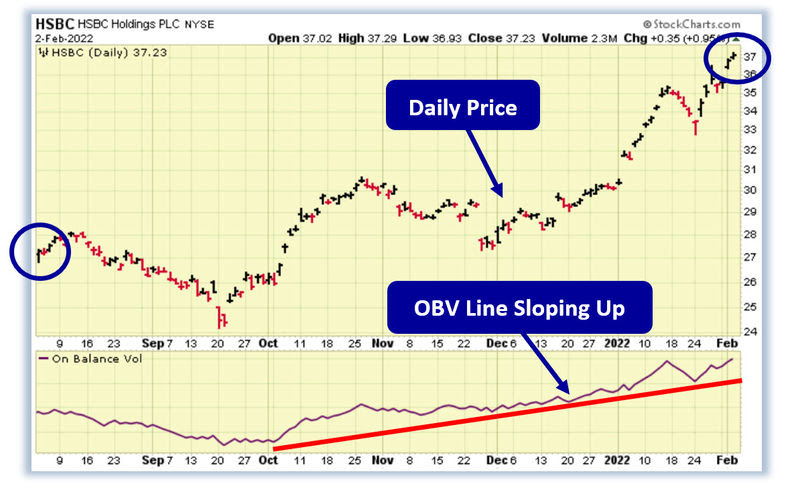
The HSBC daily price chart below shows that HSBC is in a price uptrend as the current price is above the price HSBC traded at six months ago (circled). The On Balance Volume chart is below the daily chart.
On Balance Volume measures volume flow with a single Easy-to-Read Line. Volume flow precedes price movement and helps sustain the price uptrend. When a stock closes up, volume is added to the line. When a stock closes down, volume is subtracted from the line. A cumulative total of these additions and subtractions form the OBV line.
On Balance Volume Indicator
● When Close is Up, Volume is Added
● When Close is Down, Volume is Subtracted
● A Cumulative Total of Additions and Subtractions form the OBV Line
Volume flow precedes price and is the key to measuring the validity and sustainability of a price trend.
We can see from the OBV chart below that the On Balance Volume line for HSBC is sloping up. An up-sloping line indicates that the volume is heavier on up days and buying pressure is exceeding selling pressure. Buying pressure must continue to exceed selling pressure in order to sustain a price uptrend. So, On Balance Volume is a simple indicator to use that confirms the price uptrend and its sustainability.
The numerical value of the On Balance Volume line is not important. We simply want to see an up-sloping line to confirm a price up trend.
Confirmed ‘Buy’ Signal for HSBC
Since HSBC’s OBV line is sloping up, the most likely future price movement for HSBC is up, making HSBC a good candidate for a stock purchase or a call option purchase.
Let’s use the Hughes Optioneering calculator to look at the potential returns for an HSBC call option purchase.
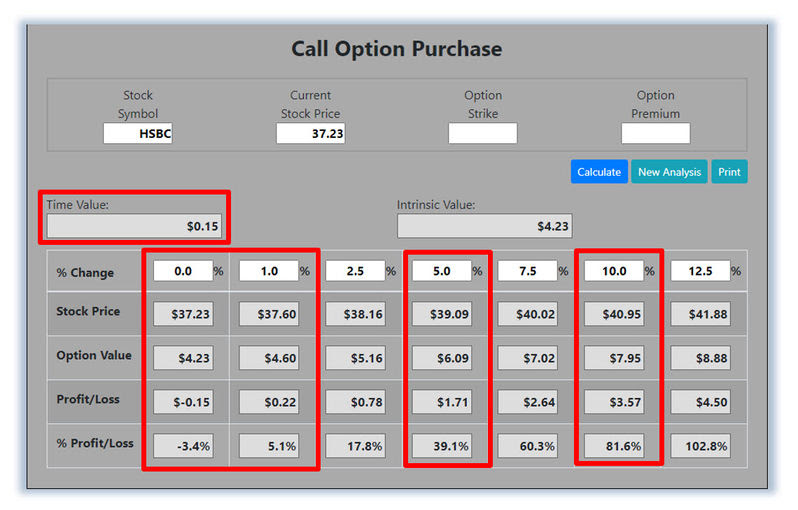
The Call Option Calculator will calculate the profit/loss potential for a call option trade based on the price change of the underlying stock/ETF at option expiration in this example from a flat HSBC price to a 12.5% increase.
The Optioneering Team uses the 1% Rule to select an option strike price with a higher percentage of winning trades. In the following HSBC option example, we used the 1% Rule to select the HSBC option strike price but out of fairness to our paid option service subscribers we don’t list the strike price used in the profit/loss calculation.
Trade with Higher Accuracy
When you use the 1% Rule to select an HSBC in-the-money option strike price, HSBC stock only has to increase 1% for the option to breakeven and start profiting! Remember, if you purchase an at-the-money or out-of-the-money call option and the underlying stock closes flat at option expiration it will result in a 100% loss for your option trade! In this example, if HSBC stock is flat at 37.23 at option expiration, it will only result in a 3.4% loss for the HSBC option compared to a 100% loss for an at-the-money or out-of-the-money call option.
Using the 1% Rule to select an option strike price can result in a higher percentage of winning trades compared to at-the-money or out-of-the-money call options. This higher accuracy can give you the discipline needed to become a successful option trader and can help avoid 100% losses when trading options.
The goal of this example is to demonstrate the powerful profit potential available from trading options compared to stocks.
The prices and returns represented below were calculated based on the current stock and option pricing for HSBC on 2/2/2022 before commissions.
When you purchase a call option, there is no limit on the profit potential of the call if the underlying stock continues to move up in price.
For this specific call option, the calculator analysis below reveals if HSBC stock increases 5.0% at option expiration to 39.09 (circled), the call option would make 39.1% before commission.
If HSBC stock increases 10.0% at option expiration to 40.95 (circled), the call option would make 81.6% before commission and outperform the stock return more than 8 to 1.
The leverage provided by call options allows you to maximize potential returns on bullish stocks.
The Hughes Optioneering Team is here to help you identify winning trades just like this one.
Interested in accessing the Optioneering Calculators? Join one of Chuck’s Trading Services for unlimited access! The Optioneering Team has option calculators for six different option strategies that allow you to calculate the profit potential for an option trade before you take the trade.
Become a Member Today!
Do you want to start receiving hand-picked trades from 10-Time Trading Champion, Chuck Hughes?
As a Trade of the Day subscriber, Chuck is offering you a special discount on his Weekly Option Alert Trading Service.
Just call Brad at 1-866-661-5664 or 1-310-647-5664 to join and use the code “Optioneering VIP” to receive special pricing!
Wishing You the Best in Investing Success,

Chuck Hughes
Editor, Trade of the Day
Have any questions? Email us at dailytrade@chuckstod.com
DISCLAIMER: The information provided by the Legacy Publishing LLC (“Legacy”) Trading Services, newsletters and educational publications (“Services”) is not customized or personalized to any particular risk profile or tolerance. Nor is the information published by Legacy a customized or personalized recommendation to buy, sell, hold, or invest in particular financial products. Past performance is not necessarily indicative of future results. Please note that results may not be typical and can vary from person to person. There are inherent risks involved with investing in the stock and options market, including the loss of your investment. Any investment is at your own risk. You should only trade or invest your “risk capital” – money you can afford to lose. Trading stocks and stock options involves high risk, and you can lose the entire principal amount invested or more. There is no guarantee that systems, indicators, or trading signals will result in profits or that they will not produce losses. Chuck Hughes’ profit results are not typical. Chuck Hughes is an experienced investor, and your results will vary depending on risk tolerance, amount of risk capital utilized, size of trading position, willingness to follow the rules and other factors. The actual profit results presented here may vary with the actual profit results presented in other Legacy publications due to the different strategies and time frames presented in other publications. Trading on margin carries a high level of risk and may not be suitable for all investors. Other than the refund policy detailed elsewhere, Legacy does not make any guarantee or other promise as to any results that may be obtained from using the Services. Open trade profit snapshots of Chuck Hughes’ trading accounts represent the open trade profit performance for the trade(s) or the portfolio displayed on the day the snapshot was taken. Open trade profits may have increased or decreased when trades were closed out. Other strategies may not have been profitable during the same time period the open trade profits were displayed. In order to avoid a conflict of interest, Trading Service recommendations were not executed by Chuck Hughes or his associates. The trade entry and exit prices (and resulting profit/loss) represent the price of the security at the time the recommendation was disseminated. Trading Service profits are not based on actual trades and have certain limitations. Because the Trading Service trades have not actually been executed, the results may understate or overstate the impact of certain market factors, such as lack of liquidity. Also, the Trading Service results do not include the costs of subscriptions, commissions, or other fees. No representation is being made that you will achieve profits or the same results as any person providing a testimonial. Testimonials may relate to various other products offered by Legacy Publishing and not the product offered here, but all of these products are based on Chuck Hughes’ system. Performance results of other products described in such testimonials may be different from results for the product being offered and may have been achieved before the product being offered was developed. Results described in testimonials from other products or the product being offered may not be typical or representative of results achieved by other users of such products. No representation is being made that any of the persons who provide testimonials have continued to experience the same level of profitable trading after the date on which the testimonial was provided. In fact, such persons may have experienced losses thereafter or may have experienced losses preceding the period of time referenced in the testimonial. Cash Payout trades receive cash credits from the sale of option premiums. The net profits for Cash Payout trades may be less than the cash received for the sale of the option premium. Some cash income figures presented represent the total amount of option premium collected during the referenced period. Actual profits were less. Auto-trading, or any broker or advisor-directed type of trading, is not supported or endorsed by Legacy Publishing LLC. For additional information on auto-trading, you may visit the SEC’s website: All About Auto-Trading, https://www.sec.gov/reportspubs/investor-publications/investorpubsautotradinghtm.html


Recent Comments