
Dear Reader,
For today’s Trade of the Day e-letter we will be looking at a daily price chart for Target Corp. (TGT).
Target Corp. has evolved from just being a pure brick-&-mortar retailer to an omni-channel entity. It has been modernizing supply chain to compete with pure e-commerce players. Its acquisition of Shipt to provide same-day delivery of groceries, essentials, home, electronics as well as other products.
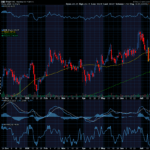
Now, let’s begin to break down the Daily Price chart with the 50-Day EMA and 100-Day EMA for TGT.

50-Day EMA and 100-Day EMA ‘Buy’ Signal
The 50-Day Exponential Moving Average (EMA) and 100-Day EMA are moving average indicator lines that can provide buy and sell signals when used together. When the shorter-term 50-Day EMA crosses above or below the longer-term 100-Day EMA, this provides either a buy or sell signal depending on which direction the stock price is moving.
When the 50-Day EMA (blue line) crosses above the 100-Day EMA (red line) this indicates that the stock’s buying pressure has begun to outweigh the selling pressure signaling a ‘buy’ signal.
Buy TGT Stock
As the chart shows, on December 13th, the TGT 50-Day EMA, crossed above the 100-Day EMA.
Now, as you can see, the 50-Day EMA is still above the 100-Day EMA meaning the ‘buy’ signal is still in play.
As long as the 50-Day EMA remains above the 100-Day EMA, the stock is more likely to keep trading at new highs and should be purchased.
Profit if TGT is Up, Down or Flat
Now, since TGT’s 50-Day EMA is trading above the 100-Day EMA and will likely rally from here, let’s use the Hughes Optioneering calculator to look at the potential returns for a TGT call option spread.
For this option spread, the calculator analysis below reveals the cost of the spread is $305 (circled). The maximum risk for an option spread is the cost of the spread.
The analysis reveals that if TGT stock is flat, up at all, or down 7.5% at option expiration the spread will realize a 63.9% return (circled).
Due to option pricing characteristics, this option spread has a ‘built in’ 63.9% profit potential when the trade was identified*.
The prices and returns represented below were calculated based on the current stock and option pricing for TGT on 3/27/2024 before commissions.

Option spread trades can result in a higher percentage of winning trades compared to a directional option trade if you can profit when the underlying stock/ETF is up, down or flat.
A higher percentage of winning trades can give you the discipline needed to become a successful trader.
The Hughes Optioneering Team is here to help you identify profit opportunities just like this one.
“Beta Testers” Wanted To Test New Trading Breakthrough
Take a look at these profit opportunities…
- A 38% gain on AAPL in just 4 days
- A 250% gain on AMD in just over 2 weeks
- 124% winner on JPM in about 3 weeks
- An incredible 305% winner on NVDA in less than 2 weeks
- And a heart-stopping 1,601% gain on SMCI in less than a month!
These trades were came from my newest trading breakthrough. Now of course not all trades are winners and past trading results can’t promise future success as trading incurs risk of loss.
But I want you to be among the first to have the opportunity to test out my newest breakthrough for yourself. Click here to get started.
Wishing You the Best in Investing Success,

Chuck Hughes
Editor, Trade of the Day
*Trading incurs risk and some people lose money trading.


Recent Comments