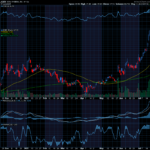
AMC Entertainment Holdings, Inc. (AMC) appeared on our list of compressed stocks this morning. You don’t need an indicator to see that the stock is trading flat near $5 a share. We use compression signals to identify stocks that are likely to break out of narrow trading ranges in the near future.
We have a checklist that we use every day to identify opportunities. One of the things we do on our checklist is look back at the history to see how the stock behaved in the past. This meme stock has not been compressed in a very long time. We also look at liquidity and we look at the borrow rate to see if the stock is being heavily shorted. AMC has plenty of liquidity and the stock is easy to borrow.
Then we look at implied volatility expectations and we construct a strategy that will provide an edge.


This Volatility Term Structure chart for AMC shows us the implied volatility for the at-the-money options for each expiration. The volatility expectations for the October 18th expiration are the lowest with enough liquidity and time for the stock to make a profitable move after the compression signal.

This Volatility Skew chart for AMC shows us the implied volatility at each strike price for the October 18th expiration. This skew shows that the options at the 6 strike price are 25% higher than options at the 5 strike. That is a huge difference, and it is a factor that will change our strategy to exploit the gap in prices.

This MDM graph compares the modeled expected distribution for future stock prices (the orange line) with the actual distribution of the stock’s prices over the past year (the blue histogram). You can see that the actual stock movement shows that the stock makes big moves more frequently than current options prices expect. This tells us that options for the October 18th expiration are relatively cheap compared to the actual history.

This Volatility Cone chart shows the implied volatility of the at-the-money options at each term (the yellow dots) along with the one-year historical average. It also shows the historical high and low over the same time period (the purple lines). This chart confirms that options at every term are priced below what one would expect based on the average historical volatility over the past two years. That is a good sign for option buyers.

AMC’s stock prices are compressed. This means that the stock is likely to break out of its narrow trading range in the next few weeks. Options prices for the October 18th expiration are relatively inexpensive. This is an option buying opportunity. Because we don’t know which direction the stock will take when the breakout move occurs, our preference is to use a neutral strategy.
When stocks get compressed, we would normally look to implement a long straddle. But when the skew is this steep, other strategies become more favorable.
To get the specific details and prices on today’s trade idea, be sure to read today’s ODDS Online Daily Option Trade Idea.
To access Odds Online Daily and be able to see any stock you are tracking in this software, click here.
Thank you,
Don Fishback


Recent Comments