
For today’s Trade of the Day, we will be looking at American International Group Inc. (AIG).
Before analyzing AIG’s chart, let’s take a closer look at the company and its services.
American International Group, Inc. offers insurance products for commercial, institutional, and individual customers in North America and internationally. The company’s General Insurance segment provides general liability, environmental, commercial automobile liability, workers’ compensation, casualty, and crisis management insurance products; commercial, industrial, and energy-related property insurance; and aerospace, political risk, trade credit, portfolio solutions, crop, and marine insurance. It also provides professional liability insurance products for a range of businesses and risks, including directors and officers, mergers and acquisitions, fidelity, employment practices, fiduciary liability, cyber risk, kidnap and ransom, and errors and omissions insurance. In addition, this segment offers personal auto and property insurance, such as auto, homeowners, umbrella, yacht, fine art, and collections; voluntary and sponsor-paid personal accident; supplemental health products; extended warranty insurance products; and travel insurance products. The company was founded in 1919 and is headquartered in New York, New York.
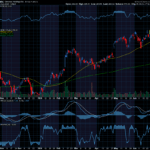
The chart of AIG below is a weekly chart with an ADX indicator at the bottom. The description coming up next explains how to use the ADX.
Average Direction Index (ADX) – Strength Indicator
The Average Directional Index consists of 3 lines: Green, Red and Black.
- Green = +DI (Bullish)
- Red = -DI (Bearish)
- Black = ADX Strength Line
The DI line that is on top is in control. If the ADX line is heading up, strength is supporting the DI line that is on top and in control.
Each candle on the chart represents price movement over a 5-day (week) period; therefore, it takes weeks for trades to play out. When the -DI crosses over the +DI line, it gives a buy signal for Puts as the -DI line (red) appears as if it is in control and rising to head up on the ADX indicator, and as the ADX turns up that is even more bearish, suggesting a downward move is gaining strength. When the +DI (green line) crosses the red and the black line points up it shows an upward trend and Calls can be considered.
Let’s look at AIG’s weekly chart.

The ADX +DI (green line) has crossed the -DI and the black ADX line is curling up. As long as the +DI is above the -DI, price should rise. The past few weeks have been positive. If you want to learn more about ADX, read on or, if not, scroll down to the alert.
Potential AIG Trade – Showing Strength
Check Out How an Option Trade Could Pay Out Big Time
Option trading offers the potential of a lower initial investment and higher percentage gain. Let’s take a look and make a comparison.
If you bought 1 stock share of AIG, it would cost about $51.09.
If you bought 1 Call option covering 100 shares of AIG with an August 19th expiration date for the 55 strike, the premium would be approximately $ 1.45 today, or $145 for 1 option. If price rose $3 over the next few weeks, the premium would likely increase $1.50, giving $150 profit on your $145 investment. This is a 103% gain.
Trading options is a win, win, win opportunity. Options often offer a smaller overall investment, covering more shares of stock and potential for greater profits.
I like to stress when trading options, you don’t need to wait for the expiration date to close the trade. You can close anywhere along the way prior to the expiration date. It is never a bad idea to take profit.
Trading options is like renting stocks for a fixed period of time. The potential to generate steady income with options is real, and it can be transforming.
Routinely remind yourself – I believe in myself and my ability to succeed. I believe in an abundance of unlimited possibilities. The future will be awesome!
I wish you the very best,
Wendy
Past potential trade update:
Last week we discussed buying PDD calls. The stock price did not reach our target entry. No trade would be taken.


Recent Comments