
Dear Reader,
Yesterday, we looked at a Monthly Price Chart of Zillow Group, Inc. noting that the stock’s 1-Month Price is trading above the 10-Month SMA signaling a ‘Buy’.
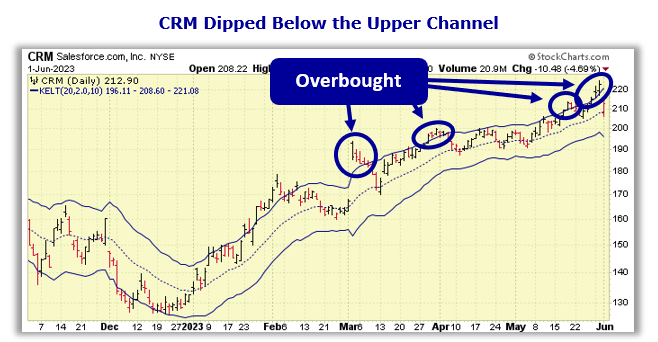
For today’s Trade of the Day we will be looking at a Keltner Channel chart for Salesforce.com, Inc. stock symbol: CRM.
Before breaking down CRM’s daily Keltner Channel chart let’s first review which products and services are offered by the company.
Salesforce, Inc. provides Customer Relationship Management (CRM) technology that brings companies and customers together worldwide. The company’s service includes sales to store data, monitor leads and progress, forecast opportunities, gain insights through analytics and relationship intelligence, and deliver quotes, contracts, and invoices; and service that enables companies to deliver trusted and highly personalized customer service and support at scale. In addition, its platform offering comprise a flexible platform that enables companies of various sizes, locations, and industries to build business apps with drag-and-drop tools; online learning platform that allows anyone to learn in-demand Salesforce skills; and Slack, a system of engagement.
Now, let’s begin to break down the Keltner Channel chart for CRM. Below is a Daily Price Chart and the three Keltner Channels for CRM stock.
Buy CRM Stock
The Hughes Optioneering Team uses the Keltner Channels as an indicator to determine whether a stock is overbought or oversold. If a stock’s daily stock price is trading above the upper Keltner Channel, this signals that the stock is temporarily overbought and subject to a retracement.
Even stocks that are in the strongest bull trends do not advance in a straight line. There are always price retracements along the way. When a stock becomes overbought, its price will typically decline soon after as the inevitable profit taking occurs.
The CRM daily price chart shows that the stock is in a strong price uptrend and has become overbought several times. You can see this as CRM has traded above the Upper Keltner Channel on multiple occasions recently.
But, in every scenario when CRM became overbought, the stock soon experienced a pullback.
Finding opportunities when a stock experiences a pullback is why the Hughes Optioneering Team uses the Keltner Channels. They help us find a lower-risk entry point.
The Keltner Channel “Buy Zone” occurs when a stock is trading below the upper Keltner Channel. Once the daily price is trading below the upper channel, it provides a lower-risk buying opportunity as the stock is likely to rally.
Our initial price target for CRM stock is 235.00 per share.

Profit if CRM is Up, Down or Flat
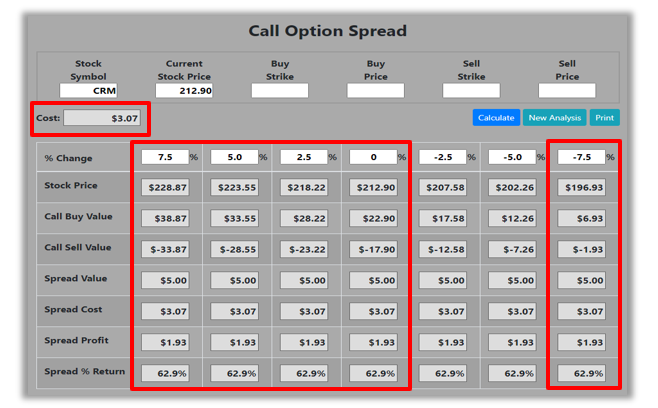
Now, since CRM is currently trading in the Keltner Channel “Buy Zone”, this provides us a prime trade entry opportunity. Let’s use the Hughes Optioneering calculator to look at the potential returns for a CRM call option spread.
The Call Option Spread Calculator will calculate the profit/loss potential for a call option spread based on the price change of the underlying stock/ETF at option expiration in this example from a 7.5% increase to a 7.5% decrease in BIIB stock at option expiration.
The goal of this example is to demonstrate the ‘built in’ profit potential for option spreads and the ability of spreads to profit if the underlying stock is up, down or flat at option expiration. Out of fairness to our paid option service subscribers we don’t list the option strike prices used in the profit/loss calculation.
The prices and returns represented below were calculated based on the current stock and option pricing for CRM on 6/1/2023 before commissions.
Built in Profit Potential
For this option spread, the calculator analysis below reveals the cost of the spread is $307 (circled). The maximum risk for an option spread is the cost of the spread.
The analysis reveals that if CRM stock is flat or up at all at expiration the spread will realize a 62.9% return (circled).
And if CRM stock decreases 7.5% at option expiration, the option spread would make a 62.9% return (circled).
Due to option pricing characteristics, this option spread has a ‘built in’ 62.9% profit potential when the trade was identified*.
Option spread trades can result in a higher percentage of winning trades compared to a directional option trade if you can profit when the underlying stock/ETF is up, down or flat.
A higher percentage of winning trades can give you the discipline needed to become a successful trader.
The Hughes Optioneering Team is here to help you identify profit opportunities just like this one.
Interested in accessing the Optioneering Calculators? Join one of Chuck’s Trading Services for unlimited access! The Optioneering Team has option calculators for six different option strategies that allow you to calculate the profit potential for an option trade before you take the trade.
Trade High Priced Stocks for $350 With Less Risk
One of the big advantages to trading option spreads is that spreads allow you to trade high price stocks like Amazon, Google, or Netflix for as little as $350. With an option spread you can control 100 shares of Netflix for $350. If you were to purchase 100 shares of Netflix at current prices it would cost about $40,000. With the stock purchase you are risking $40,000 but with a Netflix option spread that costs $350 your maximum risk is $350 so your dollar risk is lower with option spreads compared to stock purchases.
Chuck’s $3,000 Trading Scholarship
I don’t want you to miss a single opportunity to potentially reach your goals. That’s why I’d like to offer you a scholarship of the full $3,000 Enrollment Fee of my exclusive Weekly Option Alert Trading Service**.
I want you to follow in my footsteps and succeed beyond your wildest dreams, so please call Brad in my office at 1-866-661-5664 or 1-310-647-5664 and get started today!
You can also CLICK HERE to schedule a call now!
Wishing You the Best in Investing Success,

Chuck Hughes
Editor, Trade of the Day
Have any questions? Email us at dailytrade@chuckstod.com
*Trading incurs risk and some people lose money trading.
**Weekly Option Alert Trading Service program provides training package and specific trade signals for one year. The first 10 people to sign up each day this offer is valid, will get a waiver of the standard fee, which is the price charged to anyone signing up after the first 10 people per day.


Recent Comments