
We’re not sure if its because of the Grand Prix F1 race or because they announced a new hypercar, but Ferrari N.V. (RACE) is trending in the news. One headline is calling the new F80 car the ultimate collector’s piece. If you’re a car enthusiast, you’ll enjoy reading about this dream car. But you may need to save some cash if you’re thinking about buying it. The price tag for this new hybrid vehicle is $3.9 million. At that price, it’s no surprise that the stock jumped 2% yesterday on the announcement.
From an options trader’s perspective, Implied Volatility has been climbing even before the new car was announced. Investors are anticipating the scheduled earnings announcement on November 5th. Rising implied volatility means higher options prices. Higher options prices means that if we want to trade RACE options, our strategy will include selling expensive options.


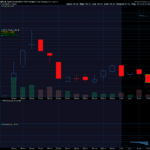
This Volatility Term Structure chart for RACE shows a spike in volatility expectations at the November 15th expiration. This spike is due to the fact that investors are anticipating the potential for a big move around the earnings report scheduled for November 5. Earnings announcement can be catalysts for big moves when the company reveals previously non-public information.

This MDM graph compares the modeled expected distribution for future stock prices (the orange line) with the actual distribution of RACE’s share prices over the last year (the blue histogram). You can see that the actual stock movement does not make big moves as frequently as options prices currently expect. This graph tells us options for the November 15th expiration are a little expensive.

This Volatility Cone chart for RACE compares implied volatility expectations for each term to the historical volatility for that same term. The blue line shows the average historical volatility; purple lines show each HV measure’s highest high and lowest low over the past year. You can see that the one-month term (which is the term we are interested in) is a little bit high, but nowhere near the extreme historical high. This confirms that options for November 15th are a bit expensive but still have a lot of room to go big.

This Volatility Skew chart for RACE compares implied volatility expectations for each strike price for the November 15th expiration. Looking at the previous charts we know that the options we’ll be buying will be a bit expensive. Looking at the skew chart we can see a steep curve that will let us sell options that are even more expensive. This graph tells us we can create a neutral strategy called a ratio backspread to reduce our costs and still have unlimited profit potential.

RACE is trending heavily in the news either because of the upcoming Grand Prix race or because of the launch of a new F80 hybrid hypercar. We don’t need to know specifically why the stock is trending to create an option trade that provides an advantage. We simply look at the data and go through our checklist to find the best trade given the current market conditions. If you’d like a copy of our checklist, which we use every morning to identify our option trades, just drop us an email and we’ll reply back with the checklist as an attachment. Here’s our email: support@donfishback.com
To get the specific details and prices on today’s trade ideas, be sure to read today’s ODDS Online Daily Option Trade Idea.
To access Odds Online Daily and be able to see any stock you are tracking in this software, click here.
Thank you,
Don Fishback


Recent Comments