
Dear Reader,
Yesterday, we looked at a Daily Price Chart of Twilio Inc., noting that TWLO’s 50-Day EMA is trading above the 100-Day EMA signaling a ‘Buy’.
For today’s Trade of the Day e-letter we will be looking at a Moving Average Convergence/ Divergence (MACD) chart for F5 Networks, Inc. stock symbol: FFIV.
Before breaking down FFIV’s MACD chart let’s first review what products and services the company offers.
F5 Networks Inc provides products and services to manage Internet traffic worldwide. Its application, delivery and networking products improve performance, availability and security of applications running on networks that use the Internet Protocol.
MACD Indicator confirms Price Momentum
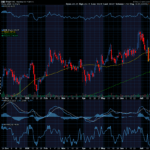
The FFIV daily price chart below shows that FFIV is in a price uptrend as the 24/52 day MACD line (black line) is above the 18-Day EMA (purple line). The Moving Average Convergence/ Divergence chart is shown below the daily price chart.
MACD uses moving averages to create a momentum indicator by subtracting the longer-term moving average from the shorter-term moving average. The MACD is calculated by subtracting a stock’s longer term 52-Day Exponential Moving Average (EMA) from its shorter term 24-Day EMA. This creates the MACD line.
MACD ‘Buy’ Signal
The 18-Day EMA line functions as a buy/sell ‘trigger’. When the 24/52 Day MACD line crosses above the 18-Day EMA line it indicates positive momentum and higher prices for the stock. When the 24/52 Day MACD lines crosses below the 18-Day EMA it indicates negative momentum and lower prices for the stock. MACD is more of a leading indicator than a moving average crossover which tends to lag price movement.
MACD Histogram shows Acceleration of Momentum
Also included in a MACD chart is the histogram bar graph. This portion of the chart helps to illustrate the distance between the 24/52 Day MACD and the 18-Day EMA.
When a crossover initially occurs, the histogram’s bar will be near flat as the two indicator lines have converged. As the lines begin to separate, the bars grow in height, indicating a widening gap and acceleration for the stock’s momentum. When the histogram’s bars begin to shrink this indicates a narrowing of the gap between the 24/52 Day MACD and the 18-Day EMA and a slowing of the stock’s momentum. When the gap between the two indicators begins to narrow, this typically indicates a crossover of the indicator lines could happen soon.

Buy FFIV Stock
As long as the 24/52 Day MACD line remains above the 18-Day EMA, the stock is more likely to keep trading at new highs in the coming days and weeks.
Since FFIV’s bullish run is likely to continue, the stock should be purchased.
Our initial price target for FFIV stock is 263.50 per share.
Profit if FFIV is Up, Down, or Flat
Now, since FFIV’s 24/52 Day MACD is trading above the 18-Day EMA and will likely rally from here, let’s use the Hughes Optioneering calculator to look at the potential returns for a FFIV call option spread.
The Call Option Spread Calculator will calculate the profit/loss potential for a call option spread based on the price change of the underlying stock/ETF at option expiration in this example from a 7.5% increase to a 7.5% decrease in FFIV stock at option expiration.
The goal of this example is to demonstrate the ‘built in’ profit potential for option spreads and the ability of spreads to profit if the underlying stock is up, down or flat at option expiration. Out of fairness to our paid option service subscribers we don’t list the option strike prices used in the profit/loss calculation.
The prices and returns represented below were calculated based on the current stock and option pricing for FFIV on 12/5/2024 before commissions.
Built in Profit Potential
For this option spread, the calculator analysis below reveals the cost of the spread is $665 (circled). The maximum risk for an option spread is the cost of the spread.
The analysis reveals that if FFIV stock is flat or up at all at expiration the spread will realize a 50.4% return (circled).
And if FFIV stock decreases 7.5% at option expiration, the option spread would make a 16.9% return (circled).
Due to option pricing characteristics, this option spread has a ‘built in’ 50.4% profit potential when the trade was identified*.
Option spread trades can result in a higher percentage of winning trades compared to a directional option trade if you can profit when the underlying stock/ETF is up, down or flat.
A higher percentage of winning trades can give you the discipline needed to become a successful trader.
The Hughes Optioneering Team is here to help you identify profit opportunities just like this one.

Trade High Priced Stocks for $350 With Less Risk
One of the big advantages to trading option spreads is that spreads allow you to trade high price stocks like Amazon, Google, or Netflix for as little as $350. With an option spread you can control 100 shares of Netflix for $350. If you were to purchase 100 shares of Netflix at current prices it would cost about $92,000. With the stock purchase you are risking $92,000 but with a Netflix option spread that costs $350 your maximum risk is $350 so your dollar risk is lower with option spreads compared to stock purchases.
‘Thunder Run’ Options
This coming Monday, for the first time ever, 10-Time Trading Champion Chuck Hughes will be revealing his all-new ‘Thunder Run’ Options Strategy!
This is the world premiere of this strategy, so if you want to be among the first-ever to lay eyes on this then you’ll need to reserve your seat for Monday’s presentation.
Now, this is going to be a hot ticket item and we very likely could run out of spots to attend. Go ahead and click the button below to make your ‘Free Reservation’ to watch the unveil of this powerful new strategy!

Wishing You the Best in Investing Success,

Chuck Hughes
Editor, Trade of the Day
Have any questions? Email us at dailytrade@chuckstod.com
*Trading incurs risk and some people lose money trading.


Recent Comments