
Is the tech market’s recent price action a bull indicator or a bear indicator?
What about this market is giving me my greatest indication of future expected movement? Is it the semiconductors (a traditionally accepted leader to the market), or is it the lack of market breadth (a traditionally accepted indicator of potential market movement)? Is it the fundamental picture of earnings, where positive news seemed to be very specific to a handful of names? Or is it the debt ceiling resolution which tends to be a positive for all as the fear in the market wanes? Is it the overbought RSI indicating a potential pullback, or the bullish MACD of the last few weeks?
My answer is, of course, all of the above. The market is pricing in all of these elements, which then leads to many technical signals, but what happens next is a derivative of fundamental news and recent price action, so that’s what I’m looking at today.
There is truly a battleground going on right now. The most bullish sector I see is semiconductors – and that’s leading to very bullish behavior in tech. So, let’s look at SMH (a semiconductor ETF) and QQQ (a NASDAQ 100 ETF):
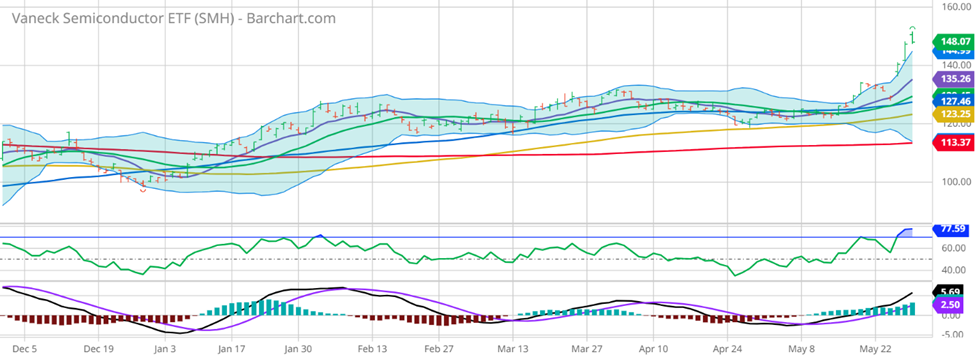


As we can all see, tech is explosive on the back of earnings in NVDA (a major semiconductor stock). This is setting up for tech to lead the market higher once again, just as it did for the last 10-15 years or more. But the RSI in QQQ is over 75, which tells me the market is overbought. When a market is overbought, the tendency is for it to have less explosive moves to the upside, and perhaps it’s time for a pullback as profit-taking occurs. With the RSI in NVDA at ~85, I’m that much more concerned that there won’t be much momentum for the next few weeks in tech.
The market has been driven by just a few stocks recently, and they’ve been very good performers. But stocks in the small cap sector, for example, have underperformed. Let’s look at a chart of IWM (a small cap ETF) and XLF (a financial sector ETF) to see a visual of what I mean:


As you can see, IWM is sitting in a range, not exploding higher like QQQ. And XLF is sitting in the middle of the recent range (significantly lower than at the start of the year), and not exploding higher like SMH.
What does this mean for the typical investor? Opportunity! I look for opportunities in those stocks that are outperforming the market, but I also look at those that have underperformed as a signal of a stock that just can’t go up…or a stock that has explosive upside! And when a stock has both, it means options are the way to go for me – I get defined risk if I’m wrong and leverage to the upside if I’m right!
So please go to http://optionhotline.com to review how I traditionally apply technical signals, volatility analysis, and probability analysis to my options trades. As always, if you have any questions, never hesitate to reach out.
Keith Harwood
Keith@optionhotline.com


Recent Comments