
Dear Reader,
Yesterday, we looked at a Monthly Price Chart of Celsius Holdings Inc., noting that the stock’s 1-Month Price is trading above the 10-Month SMA signaling a ‘Buy’.
For today’s Trade of the Day e-letter we will be looking at a Moving Average Convergence/ Divergence (MACD) chart for Centene Corp. stock symbol: CNC.
Before breaking down CNC’s MACD chart let’s first review what products and services the company offers.
Centene Corporation operates as a multi-national healthcare enterprise that provides programs and services to under-insured and uninsured individuals in the United States. Its Managed Care segment offers health plan coverage to individuals through government subsidized programs, including Medicaid, the State children’s health insurance program, long-term services and support, foster care, and medicare-medicaid plans, which cover dually eligible individuals, as well as aged, blind, or disabled programs.
MACD Indicator confirms Price Momentum
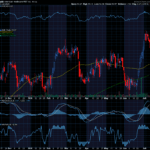
The CNC daily price chart below shows that CNC is in a price uptrend as the 24/52 day MACD line (black line) is above the 18-Day EMA (purple line). The Moving Average Convergence/ Divergence chart is shown below the daily price chart.
MACD uses moving averages to create a momentum indicator by subtracting the longer-term moving average from the shorter-term moving average. The MACD is calculated by subtracting a stock’s longer term 52-Day Exponential Moving Average (EMA) from its shorter term 24-Day EMA. This creates the MACD line.
MACD ‘Buy’ Signal
The 18-Day EMA line functions as a buy/sell ‘trigger’. When the 24/52 Day MACD line crosses above the 18-Day EMA line it indicates positive momentum and higher prices for the stock. When the 24/52 Day MACD lines crosses below the 18-Day EMA it indicates negative momentum and lower prices for the stock. MACD is more of a leading indicator than a moving average cross over which tends to lag price movement.
MACD Histogram shows Acceleration of Momentum
Also included in a MACD chart is the histogram bar graph. This portion of the chart helps to illustrate the distance between the 24/52 Day MACD and the 18-Day EMA.
When a crossover initially occurs, the histogram’s bar will be near flat as the two indicator lines have converged. As the lines begin to separate, the bars grow in height, indicating a widening gap and acceleration for the stock’s momentum. When the histogram’s bars begin to shrink this indicates a narrowing of the gap between the 24/52 Day MACD and the 18-Day EMA and a slowing of the stock’s momentum. When the gap between the two indicators begins to narrow, this typically indicates a crossover of the indicator lines could happen soon.

Buy CNC Stock
As long as the 24/52 Day MACD line remains above the 18-Day EMA, the stock is more likely to keep trading at new highs in the coming days and weeks.
Since CNC’s bullish run is likely to continue, the stock should be purchased.
Our initial price target for CNC stock is 98.00 per share.

92.3% Profit Potential for CNC Option
Now, since CNC’s 24/52 Day MACD is trading above the 18-Day EMA this means the stock’s bullish rally will likely continue. Let’s use the Hughes Optioneering calculator to look at the potential returns for a CNC call option purchase.
The Call Option Calculator will calculate the profit/loss potential for a call option trade based on the price change of the underlying stock/ETF at option expiration in this example from a flat CNC price to a 12.5% increase.
The Optioneering Team uses the 1% Rule to select an option strike price with a higher percentage of winning trades. In the following CNC option example, we used the 1% Rule to select the CNC option strike price but out of fairness to our paid option service subscribers we don’t list the strike price used in the profit/loss calculation.
Trade with Higher Accuracy
When you use the 1% Rule to select a CNC in-the-money option strike price, CNC stock only has to increase 1% for the option to breakeven and start profiting! Remember, if you purchase an at-the-money or out-of-the-money call option and the underlying stock closes flat at option expiration it will result in a 100% loss for your option trade! In this example, if CNC stock is flat at 93.32 at option expiration, it will only result in a 3.9% loss for the CNC option compared to a 100% loss for an at-the-money or out-of-the-money call option.
Using the 1% Rule to select an option strike price can result in a higher percentage of winning trades compared to at-the-money or out-of-the-money call options. This higher accuracy can give you the discipline needed to become a successful option trader and can help avoid 100% losses when trading options.
The goal of this example is to demonstrate the powerful profit potential available from trading options compared to stocks.
The prices and returns represented below were calculated based on the current stock and option pricing for CNC on 8/8/2022 before commissions.
When you purchase a call option, there is no limit on the profit potential of the call if the underlying stock continues to move up in price.
For this specific call option, the calculator analysis below reveals if CNC stock increases 5.0% at option expiration to 97.99 (circled), the call option would make 44.2% before commission.
If CNC stock increases 10.0% at option expiration to 102.65 (circled), the call option would make 92.3% before commission and outperform the stock return more than 9 to 1*.
The leverage provided by call options allows you to maximize potential returns on bullish stocks.
The Hughes Optioneering Team is here to help you identify winning trades just like this one.

Interested in accessing the Optioneering Calculators? Join one of Chuck’s Trading Services for unlimited access! The Optioneering Team has option calculators for six different option strategies that allow you to calculate the profit potential for an option trade before you take the trade.
Average Portfolio Return of 299.8%
Below is a screenshot of the current open trade profit opportunities from Chuck’s Inner Circle Trading Service. There are currently $208,641.08 in open trade profits with an average portfolio return of 299.8% demonstrating the ability of the Optioneering Strategy to deliver substantial returns with no losing portfolios**.

**Open trade profit results represent the open trade profit performance for the portfolio displayed on the day the snapshot was taken. Open trade profits may have increased or decreased when trades were closed out.
Afraid of Market Volatility Rocking Your IRA?
Chuck Hughes isn’t afraid of market volatility, he takes advantage of it. Chuck is used to turbulence.
His years as a pilot gave him the ability to weather even the worst storms.
He has tested and proven strategies that thrive during turbulent market conditions*.
You could gain access to these strategies and start receiving hand picked trades from Chuck today!
Just call Brad at 1-866-661-5664 or 1-310-647-5664 to join or you can CLICK HERE to schedule a call!
Wishing You the Best in Investing Success,

Chuck Hughes
Editor, Trade of the Day
Have any questions? Email us at dailytrade@chuckstod.com
*Trading incurs risk and some people lose money trading.
**Open trade profit results represent the open trade profit performance for the portfolio displayed on the day the snapshot was taken. Open trade profits may have increased or decreased when trades were closed out. Trading incurs risk and some people lose money trading. Past performance does not necessarily predict future results. Member profits and losses are not tracked. Profit potential is taken from results of signaled trades, not actual member results. Not all members make the trades.


Recent Comments