
There are a lot of factors that indicate we are going to see a continued drop in the markets. While nothing is guaranteed, it is hard to argue the probability of a continued decline is very significant. As we set up positions based on this likelihood, we also want to start watching what signs will indicate a bottom and a confirmation that this drop is over. (We talked about some ideas for trading a drop yesterday. You can read that here)
Keep in mind, the decline could be protracted and will almost certainly be wild and whipsawed. This will make spotting a true bottom a bit more challenging. Here are some of the tools you can use to have confidence you are reading the momentum correctly.
The VIX
We have talked about the VIX in the past as an indicator of when markets will drop. Logically if you start to reverse that approach you can use volatility to confirm the bottom and a potential reversal. There is a very strong correlation that the VIX rises when markets are going down. When we see the VIX settle, it can be a strong sign that things are ready to reverse.
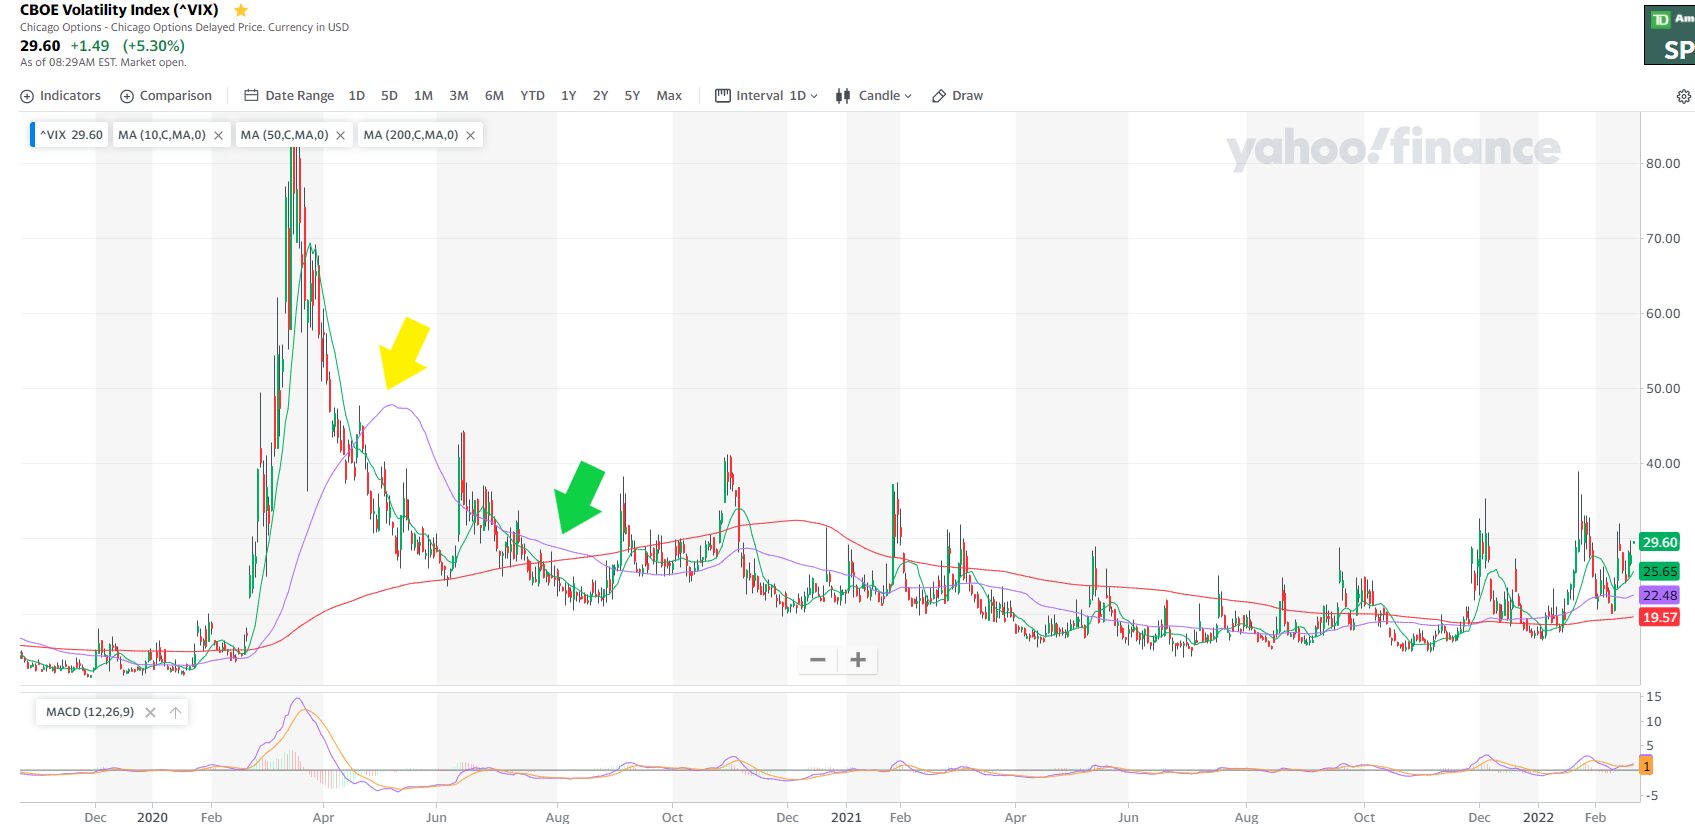
Youi can see that when the VIX drops below the 50 day moving average after the COVID crash at the yellow arrow, it gives us a heads up that the bottom is coming. We saw the exact bottom a couple weeks later in May and in a perfect world we could have hit that on the mark but it doesn’t always work like that. What this type of information tells you is where the broader momentum is. The green arrow highlights where the VIX moved below its 200 day moving average. even if you waited till then to get back in, the S&P moved up almost 50% over the next 16 or so months. That is great but if you added options positions to that move it was very lucrative.

Index ETFs
We have been talking about these alot lately and for good reason. They are an incredibly effective tool. Even more so when markets are dropping. By watching the inverse index ETFS that move in the opposite direction of the index a clear top or very defined resistance is another confirmation of a bottom for the overall market.
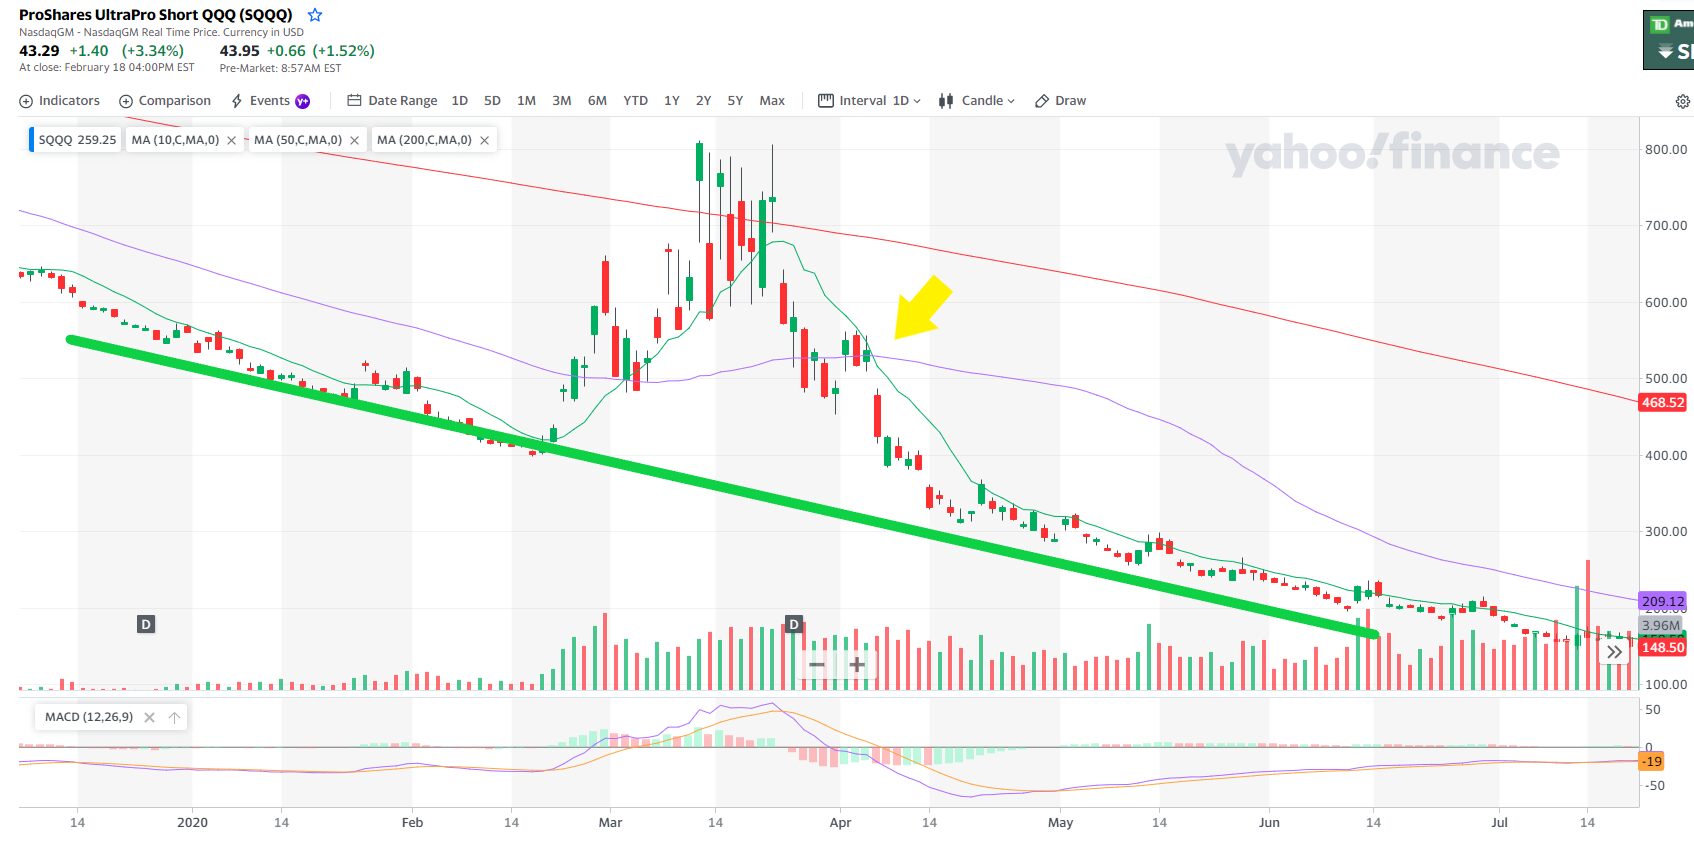
When you look at the chart above of SQQQ, the inverse ETF that tracks the NASDAQ, You can see that after the COVID crash SQQQ crossed its 10, 50, and 200 day moving averages in April at the yellow arrow giving us a heads up that the market had the upward strength to recover. Since tech is often a leading sector SQQQ will show some of the earliest signs of a shift. You can also see SQQQ get back on its previous trend a couple weeks after that giving further confirmation. As the size of the candles get smaller that also shows that the trend is consistent and has strength.
These are just a couple tools to spot a bottom but it is always wise to confirm these type of reversals with multiple indicators. The big advantage of having confidence in your understanding of the trend is that you can then increase position size in your trades as the probability of a surprise shift declines. It can also help in structuring the ideal options trades and help identify strategies that work best in trending markets.
Just as when a trend hits a top and starts to reverse it is showing signs if exhaustion, the same thing is happening at a bottom when the drop is wearing out. Lee Gettess identified some of the most effective patterns for spotting market exhaustion and has proven they work for both tops and bottoms. Be sure to check it out here.
Keep learning and trade wisely,
John Boyer
Editor
Market Wealth Daily


Recent Comments