
A week ago many of the headlines had us thinking we were ready for a full on market collapse. A lot was being made about markets moving into an official correction. It was easy to feel like everything was going to go straight down.
Keith Harwood jumped in and helped us see that it wasn’t quite like that and that there was more going on than just a dive off the cliff (your can read that article here). Not only did he point out that the VIX was giving us clues that this market would lumber more than nosedive and possibly even refill toward previous levels, he pointed out that certain sectors were positioned to benefit more than others. Specifically he spotted a set up in XLU, the Utilities ETF.
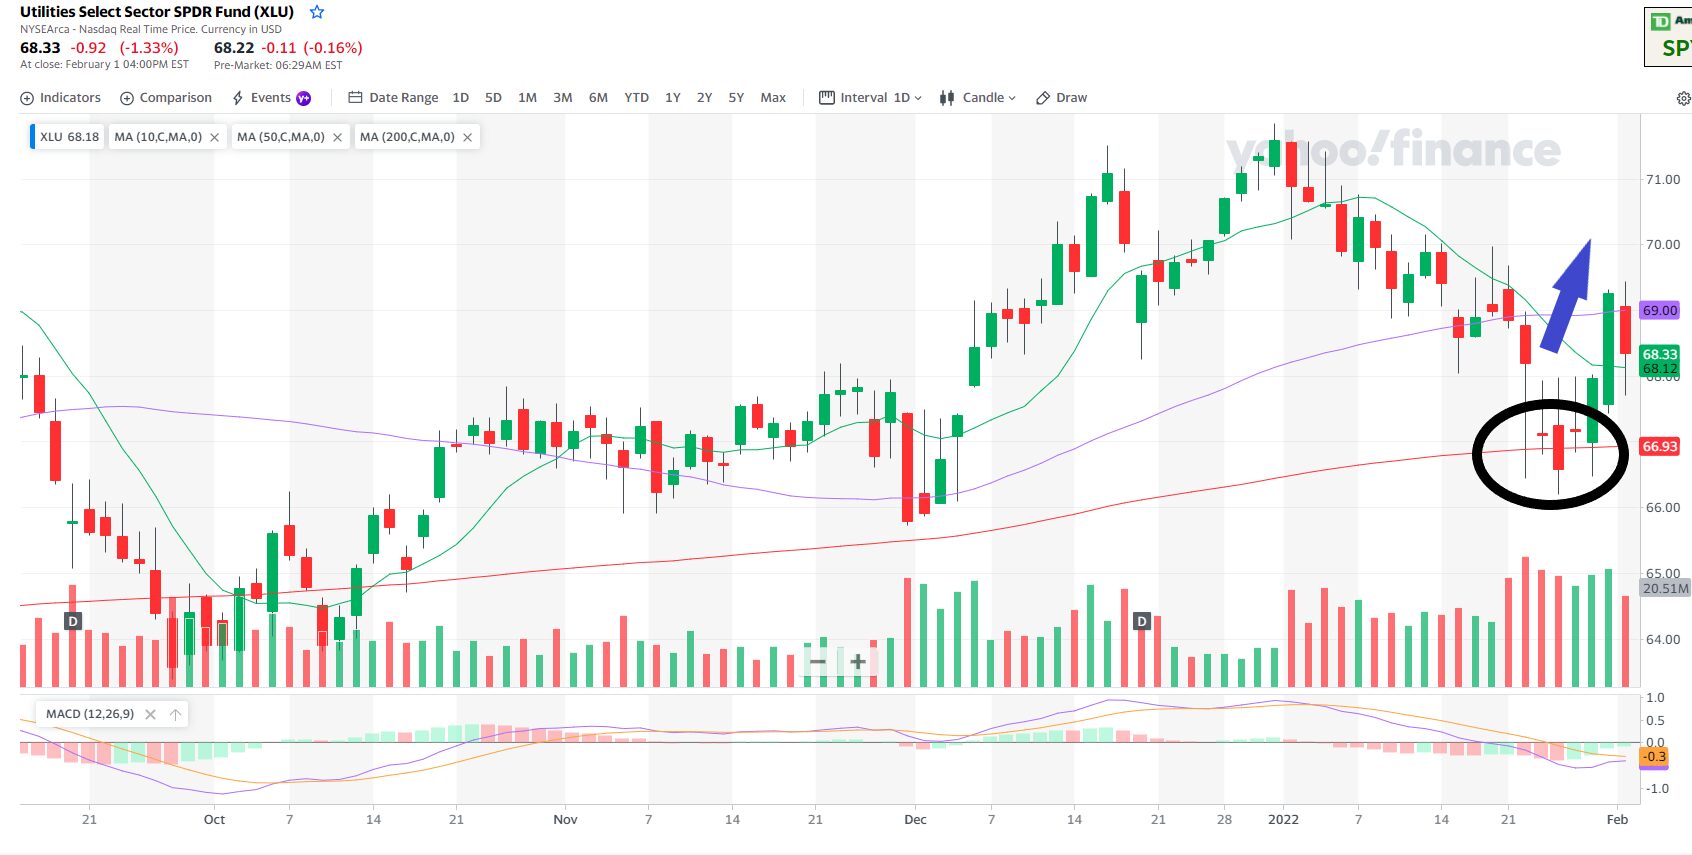

As you can see in the chart above, it found support at the 200, just as Keith had pointed out and made a very nice move off that support. The circle shows what he noticed last week and you can see the move upward.
This is why we keep bringing Keith back to help us cut through the noise and find an edge we can use when markets get squirrely. In fact, I used another tip from Keith to see a breakout from the recent bottom in the SPY. He is a big fan of using the 10 day Moving Average as an early warning that a shift is coming. You can see on the chart here that exact setup playing out just a couple days ago on this chart of the SPY:
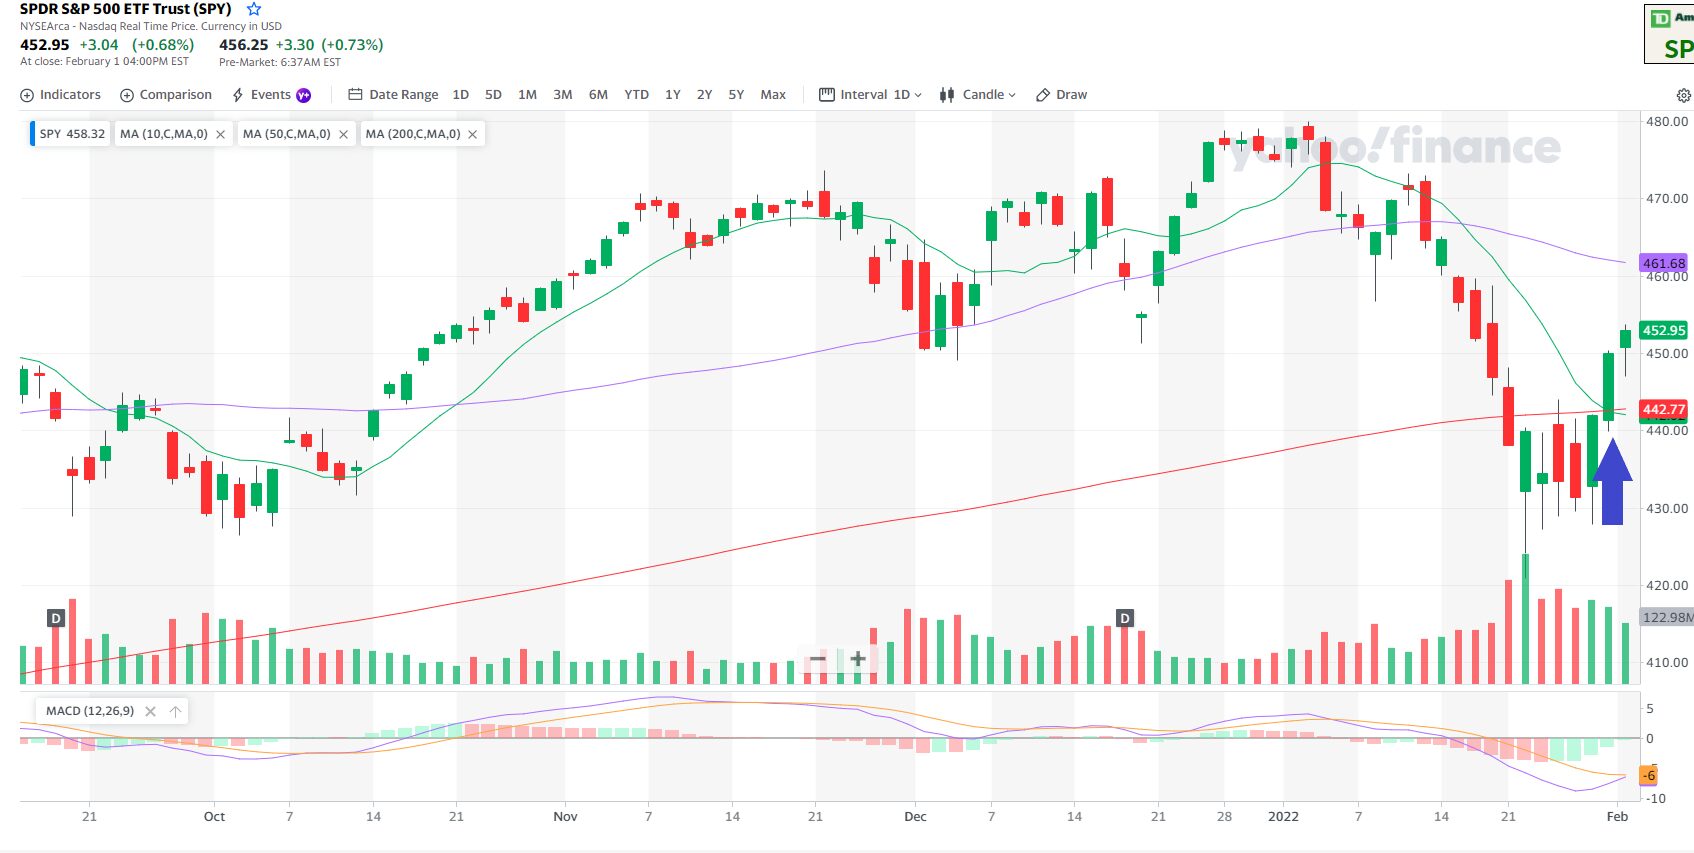
You can see that early Monday SPY broke above the 10 day and looks to keep that move going even further.
These are simple tips but are the exact advice I am looking for when the intensity kicks up. Even if it is something I may have already learned, being able to zero in on the fundamentals is always a refreshing reminder.
Keith outlined a bunch of these tricks he picked up as a market maker on the floor of the CBOE and put them together in a cheat sheet to help other traders. You can grab a copy here.
Keep learning and trade wisely,
John Boyer
Editor
Market Wealth Daily


Recent Comments