
Happy Wonderful Wednesday!
Last week the Nasdaq was down 3 out of 5 days. When the market goes into a downtrend you can buy Puts instead of Calls. Today we are going to look at a Put.
To review past equity candidates, scroll down.
For today’s Trade of the Day, we will be looking at Block Inc., symbol (SQ). Before analyzing SQ’s chart, let’s take a closer look at the stock and its services.
Block, Inc., together with its subsidiaries, creates tools that enables sellers to accept card payments and provides reporting and analytics, and next-day settlement. It provides hardware products, including Magstripe reader, which enables swiped transactions of magnetic stripe cards; Contactless and chip reader that accepts Europay, MasterCard, and Visa (EMV) chip cards and Near Field Communication payments; Square Stand, which enables an iPad to be used as a payment terminal or full point of sale solution; Square Register that combines its hardware, point-of-sale software, and payments technology; Square Terminal, a payments device and receipt printer to replace traditional keypad terminals, which accepts tap, dip, and swipe payments. The company was formerly known as Square, Inc. and changed its name to Block, Inc. in December 2021. Block, Inc. was founded in 2009 and is headquartered in San Francisco, California.
On the ADX indicator below the chart, notice how the red -DI line is on top of the +DI line (green) and the ADX. The black line of the ADX line has turned up. These are all signals of building bearish strength with the thought that price may move down.
For those who want more info on ADX, I give more details in the section below, or scroll down to the trade info.
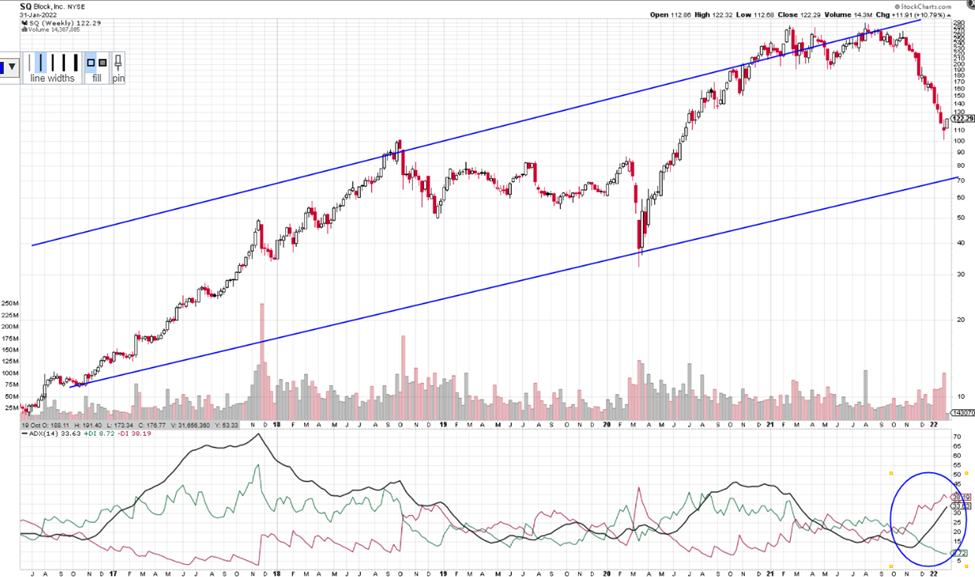

Average Directional Index (ADX) Points to Direction and Strength
ADX is an easy indicator to interpret. The +DI line (green) is bullish and when it is on top, it suggests price is going to head up. When the -DI line (red) is on top, it suggests price is going to drop.
The black line is the strength line and when it heads up, it is telling you strength is moving into the DI line that is on top and in control. When the ADX line has been heading down, the DI line on top has been weakening and is ready for a change.
When the DI lines swap places and cross up and the ADX heads up, it suggests strength is moving into the new DI direction.
ADX signal = Profit Payout
Each candle on the chart represents price movement of a week. As the +DI heads up and moves further above the black line and both rise above the red line, it suggests there is bullish strength that could continue to grow, especially once the black line starts to turn up. If price continues to rise, the ADX line (black) will continue to turn to head up to imply that strength will continue to support the trade. As long as the ADX is heading up, it means it is supporting the bullish- up direction. The opposite is true if the -DI line heads up to cross the +DI line – this suggests bearish strength and a climb in price. If the ADX line heads up while the red line -DI is on top, is it saying strength is building into the downward direction.
I am looking at its chart and possible trade on Monday, but the pattern looks as if it is in a downtrend and will continue. The -DI may continue heading up if price keeps falling. You don’t want to consider entry if the current candle doesn’t move below 120 or if the -DI line were to turn down and drop below the ADX.
If you are interested in learning more about the ADX strength line, I’d like to suggest you consider getting Inevitable Trend Moves. This book covers in detail how to trade the ADX to jump in during a confirmed strength stage that is as clear as looking at a picture with arrows pointing out direction.
SQ Potential Trade
Please note and remember that I am typing this on Monday, two days before you receive it and the information, I am sharing could change over those two days and is intended to share the opportunities that options offer us.
Block Inc. (SQ) has been heading down for a few weeks, suggesting that the downtrend is strong. It appears to be ready to head lower and the -DI has crossed up, if this continues, the pattern should remain intact as price keeps falling. Notice the -DI is above the +DI line on the chart above. We want the -DI to stay above the +DI (red line above green) to consider a Put trade. Then we’ll hope the ADX continues its upward strength.
Price is likely to fall further and move past the 120 entry. Its first target is 115 as the -DI (red line) stays above and the ADX (black line) continues to head up. Its current downtrend should remain intact, and price should continue to fall, perhaps even go lower. We will keep an eye on SQ over the next couple weeks.
To buy shares SQ today, price would be approximately $122. It would be silly to buy shares if you expect price to drop as we do. You’d wait until it hit a bottom and started to rise again.
This said, option trading offers the potential of a smaller initial investment and higher percentage gain even when price is expected to rise or fall. Let’s take a look.
If you bought one Put option contract covering 100 shares of SQ’s stock with a February 18th expiration date (Feb22) for the $115 strike premium would be approximately $4.55 today or a total of $455 per contract. If price fell the expected $7 to the $115 target over the next couple weeks, the premium might increase approximately $3.50 to $8.05 per share on your 100-share contract. This is a gain of $350 on your $455 investment or a 77% gain over a couple weeks.
Remember you can close an option trade anywhere along the line before expiration to take gains or stop a loss.
Options can offer a win, win, win trade opportunity. They often offer a smaller overall investment, covering more shares of stock and potentially offer greater profits.
If you are having any kind of trouble taking advantage of these trades, I don’t want you to miss out. I have put together programs that help traders just like you access the potential profits that options provide. I write like we are having a conversation, so the information is easy to understand and apply. Be sure to check out the programs shared in this email and we will make it easy for you to get your share.
I love to trade, and I love to teach. It is my thing.
Yours for a prosperous future,
Wendy Kirkland
PS-I have created this daily letter to help you see the great potential you can realize by trading options. Being able to recognize these set ups are a key first step in generating wealth with options. Once you are in a trade, there is a huge range of tools that can be used to manage the many possibilities that can present themselves. If you are interested in learning how to apply these tools and increase the potential of each trade, click here to learn more.

Review of Past Candidates:
Last week we discussed buying FB Feb 18th 290 Puts for 8.80. If you sold on 1/27 the premium would be 12.50 or a 42% profit. We will continue to monitor this trade.
Two weeks ago we discussed buying CRM Feb 18th 230 Puts. On Wednesday the premium would have been $10.85. If you sold Friday January 21st the premium would have been $15.45 or a 42% profit. If you sold on January 26th premium would have been 20.75 or a 91% profit.


I wish I undestood all of this as you do. I have a small Robinhood Account where I can sell puts and supplement my income but havent been brave enough to try it, I don’t know what I would do if it went wrong and I ended up paying them instead of them paying me. I hope I get the nerve to do it soon because it would be great to have more income. Were you affraid when you first started? You certainly seem to be good at teaching. I enjoy your emails Wendy! thanks Lona