
Last week started out with a healthy drop in the markets but by Friday we saw all the signs pointing to this being just another correction and not a full on reversal. We aren’t out of the woods yet but this does create some nice opportunities.
We have watched the S&P take these breaths consistently all year long, but this one was a little different. Take a look at the chart below:

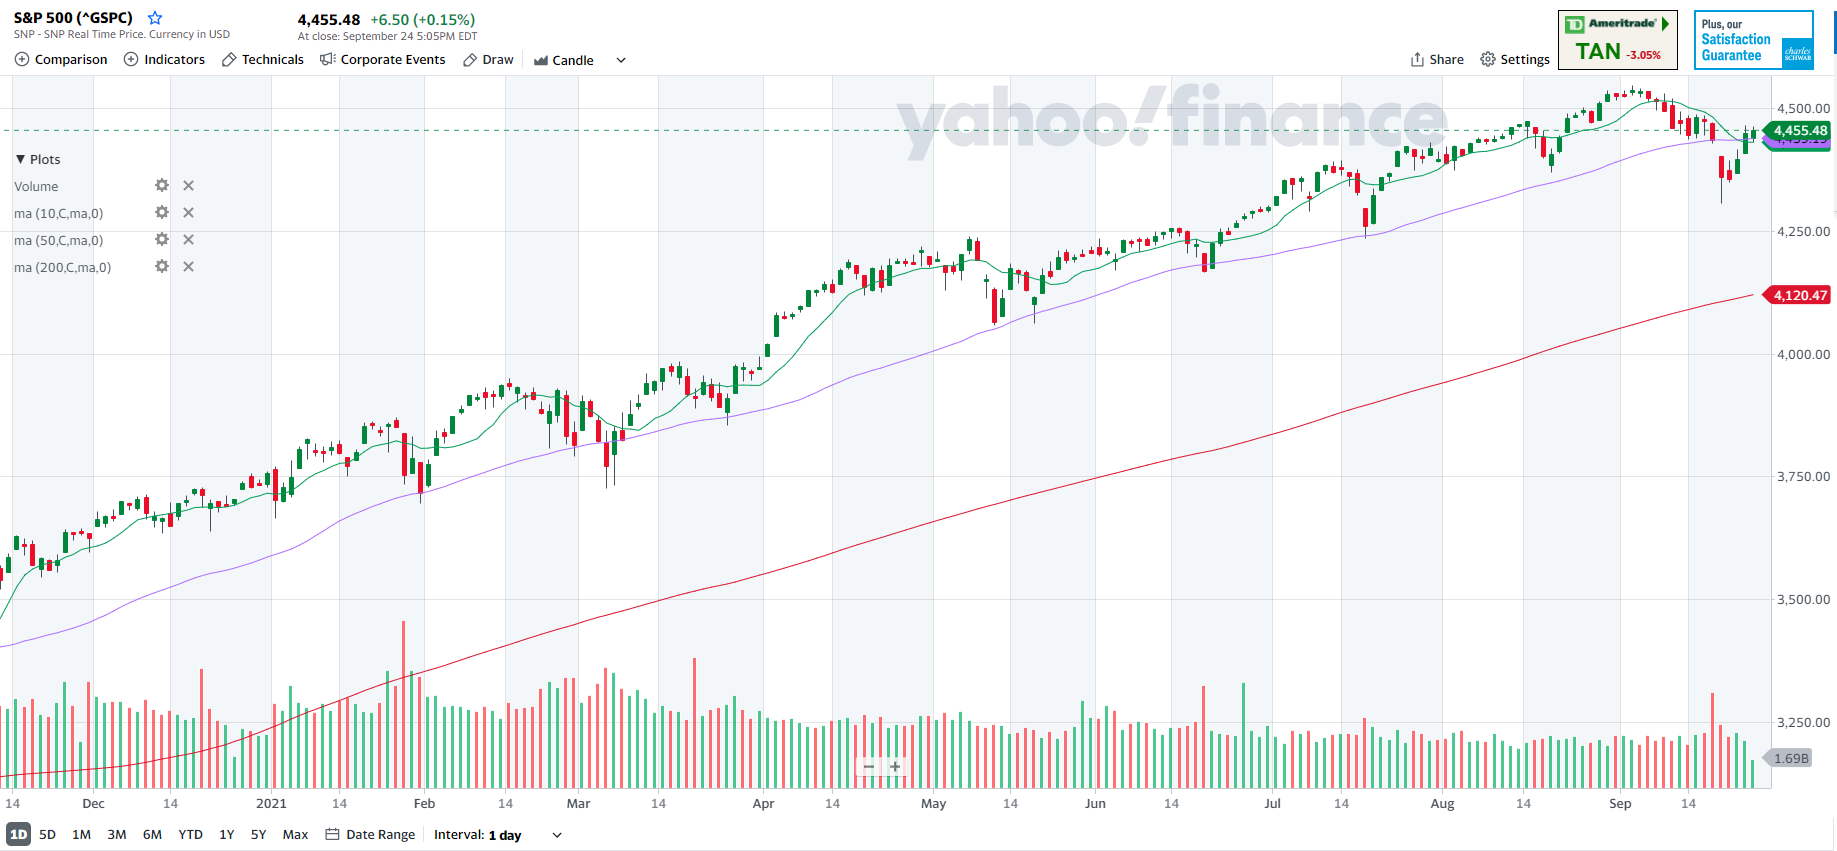
Consistently since Jan, the S&P has periodically pulled back to its 50 day moving average and then recovered. Last week we saw it drop a decent amount below the 50. Since each of the previous recoveries were about a 150-200 point run up, that gives us some idea of what to expect next.
The difference however is that the bigger drop could mean a bigger run. It wouldn’t have made sense to take the risk on grabbing a piece of this run until we crossed back above the 10 day which happened late last week.
The possibility is still there that it could just be the first bounce on the way down so finding a good option trade to grab the potential gain to the upside and setting a fixed amount of risk to the downside makes a lot of sense.
Looking at where the trendline was headed before this drop occurred gives us a nice price target to use to build the option trade. The trend would have put us at about 455 if it had continued. We can grab a SPY (the ETF that tracks the S&P) Oct 22 call with a 450 strike for 3.13. It is a bit of a long shot but if we see a recovery here that could be a potential doubler.
Check in this week and we’ll keep you posted on how this plays out.
If you are looking for more guidance on trading options, grab Chuck Hughes detailed guide here.
Keep learning and trade wisely,
John Boyer
Editor
Market Wealth Daily
PS-Lee Gettess is sitting down with us this Wednesday evening to walk through his process that just gave him a 99% win in just 3 days. Don’t miss your chance to see how it works. Sign up here.


Recent Comments