
From Keith Harwood, OptionHotline.com
The market isn’t in a freefall, yet. Let’s take a look at what’s happening now.
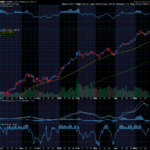
First, looking simply at the S&P 500, we see a pullback after failing to push through the 200-Day Moving Average:


Given that the normal mid-term moving averages are holding (so far), I’m interested in looking at buying opportunities.
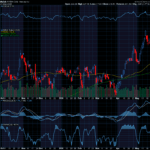
Second, I want to look at the normal technical signal I’m looking for to tell me when I should be buying. I have a few technical setups that I like for evaluating those potential setups:

*From Chartpatterns.com
Given this, I can say that the market isn’t set up to buy quite yet until I see that Bull Flag Setup, but it’s close. Once the market can resume the up-trend by breaching the prior day’s high, that should signify some buying interest.
Finally, I look for the options metrics to see how I want to enter my trade, with my primary input being the VIX:

With the VIX near lows but not at lows, a call spread may be of more interest for the overall market if and when the market finds a bottom.
At the end of the day, there are a lot of potential inputs here, and while the market may not be certain, there’s a lot of potential to the upside if and when the technicals and options analytics align, and the best way to express those views tends to be via options!
If you’d like to learn more, please go to http://optionhotline.com to review how I traditionally apply technical signals and probability analysis to my options trades. As always, if you have any questions, never hesitate to reach out.
Keith Harwood
Keith@optionhotline.com


Recent Comments