
It’s time to really evaluate overall markets again. Breakouts or collapses seem to be getting into position in broad indexes, and once that first move happens, it could set up everyone else.
So, let’s look first at SPY, the S&P 500 ETF that I monitor for our first levels of interest:
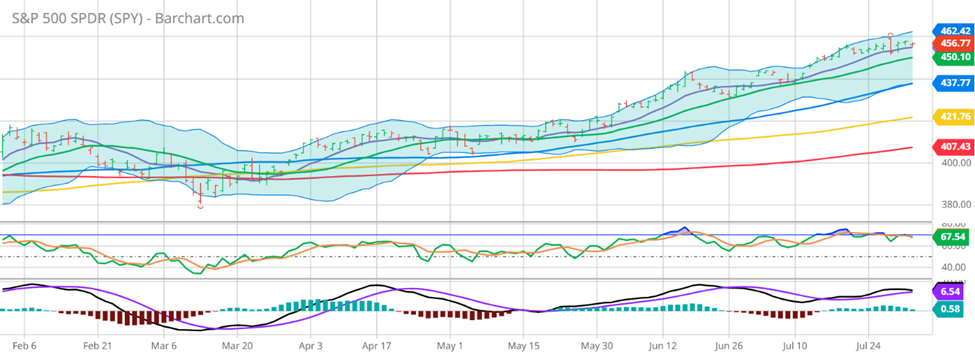
For SPY, I start to get concerned below the 10-Day Moving Average, as that would signal some potential for collapse. However, a move above last week’s high sets up a potential breakout move with increased buying as we have seen throughout the rally. For now, I don’t see a clear decision, but we’re talking about moves in the range of 1% to set the tone for the broad market, and that could happen in the blink of an eye.
Perhaps tech can give us an answer with a review of QQQ, the NASDAQ 100 ETF that I watch:
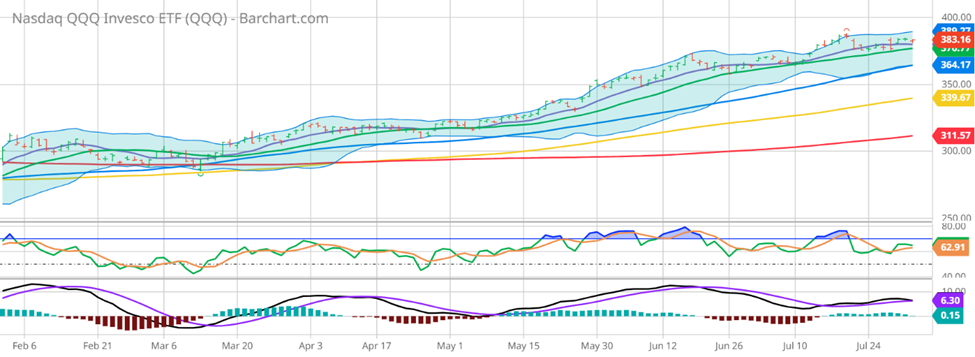

In this case, I’m looking at the 20-Day Moving Average to provide support while the highs of July would be resistance. Similar to SPY, this gives us a tight range to monitor while waiting for a true signal. At the end of the day, SPY seems more likely to give the first signal than QQQ due to the proximity of the support and resistance levels.
And perhaps the best signal and trading device right now is IWM, a small cap ETF that I follow closely:
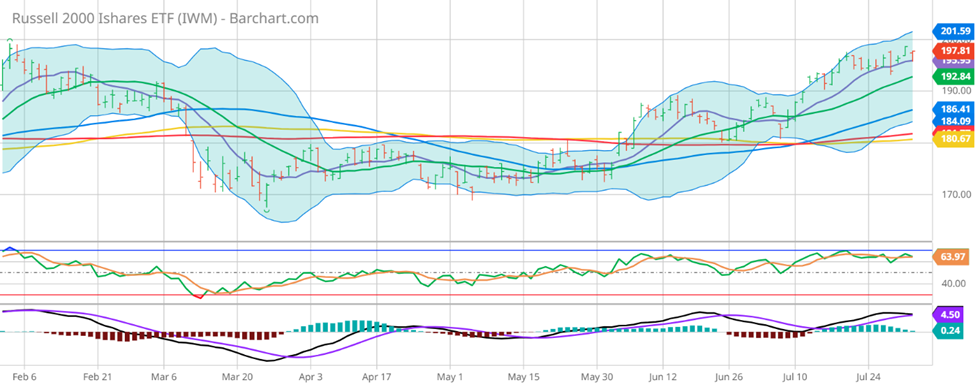
Here, the 10-Day Moving Average provides clear support while there is clear resistance at Monday’s high. We are looking at under a 1% range again, but with the formation being an ascending triangle, I’m much more excited about the potential in the case of a breakout. And since IWM has been a hated ETF relative to SPY and QQQ for years, the downside is probably likely to be quicker as I simply expect we won’t see aggressive buyers of the dip.
Let’s note now the Implied Volatility levels of these 3 ETFs to give some reference to how much we could expect the options are pricing in for movement, with percentages based upon 30-Day options:
SPY: 11.50% annual or 0.71% daily
QQQ: 17.65% annual or 1.09% daily
IWM: 17.52% annual or 1.08% daily
What this means is that while IWM has the most explosive potential to me, it’s also not being priced in as well – IWM and QQQ have the same implied volatility while IWM hits breakout points on the upside and downside with very small moves. SPY hits breakout and breakdown points around the same as IWM in percentage terms but has had a significantly tighter range and seemingly less explosive potential. For this reason, I want to focus my attention on IWM components that are potentially potent trade ideas! That’s what I’ll be looking at this weekend in my watchlist in order to make sure to give some of the most explosive options/technical setups in the market!
So, if you’re looking for new ideas, my outlier watch list can provide them for you. Please make sure to sign up now for trading ideas that can show you how a professional trader evaluates the markets to find opportunities in any trading environment.
And please, go to http://optionhotline.com to review how I traditionally apply technical signals, volatility analysis, and probability analysis to my options trades. As always, if you have any questions, never hesitate to reach out.
Keith Harwood
Keith@optionhotline.com


Recent Comments