
Dear Reader,
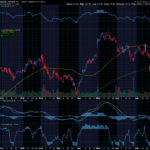
Yesterday, we looked at a Daily Price Chart of CrowdStrike Holdings, Inc., noting that CRWD’s OBV is sloping up, validating the stock’s recent bullish trend.
For today’s Trade of the Day e-letter we will be looking at a daily price chart for the iShares U.S. Home Construction ETF, symbol: ITB.
Before breaking down ITB’s daily chart let’s first review what products and services the company offers.
The iShares U.S. Home Construction ETF seeks to track the investment results of an index composed of U.S. equities in the home construction sector. The Fund seeks investment results that correspond generally to the price and yield performance of the Dow Jones U.S. Select Home Builders Index.
Now, let’s begin to break down the Daily Price chart for the ITB ETF.
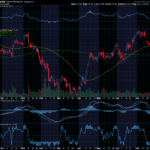
Below is a Daily Price chart with the 50-Day EMA and 100-Day EMA for ITB.

50-Day EMA and 100-Day EMA ‘Buy’ Signal
The 50-Day Exponential Moving Average (EMA) and 100-Day EMA are moving average indicator lines that can provide buy and sell signals when used together. When the shorter-term 50-Day EMA crosses above or below the longer-term 100-Day EMA, this provides either a buy or sell signal depending on which direction the ETF price is moving.
- 50-Day EMA line Above 100-Day EMA = Price Uptrend = Buy signal
- 50 Day EMA line Below 100-Day EMA = Price Downtrend = Sell signal
When the 50-Day EMA (blue line) crosses above the 100-Day EMA (red line) this indicates that the ETF’s buying pressure has begun to outweigh the selling pressure signaling a ‘buy’ signal. When the 50-Day EMA crosses below the 100-Day EMA this indicates that the selling pressure has begun to outweigh the buying pressure signaling a ‘sell’ signal.
Buy the ITB ETF
As the chart shows, on November 15th, the ITB 50-Day EMA, crossed above the 100-Day EMA.
This crossover indicated the buying pressure for the ITB ETF exceeded the selling pressure. For this kind of crossover to occur, an ETF has to be in a strong bullish trend.
Now, as you can see, the 50-Day EMA is still above the 100-Day EMA meaning the ‘buy’ signal is still in play.
As long as the 50-Day EMA remains above the 100-Day EMA, the ETF is more likely to keep trading at new highs and should be purchased.
Our initial price target for the ITB ETF is 115.25 per share.
97.7% Profit Potential for ITB Option
Now, since ITB’s 50-Day EMA is trading above the 100-Day EMA this means the ETF’s bullish rally will likely continue. Let’s use the Hughes Optioneering calculator to look at the potential returns for an ITB call option purchase.
The Call Option Calculator will calculate the profit/loss potential for a call option trade based on the price change of the underlying stock/ETF at option expiration in this example from a flat ITB price to a 12.5% increase.
The Optioneering Team uses the 1% Rule to select an option strike price with a higher percentage of winning trades. In the following ITB option example, we used the 1% Rule to select the ITB option strike price but out of fairness to our paid option service subscribers we don’t list the strike price used in the profit/loss calculation.
Want more trade highlights like this one, except with actionable option trade recommendations? Click here to check out my Weekly Optioneering Newsletter. Right now, the first month costs just $1, a fraction of the normal $39 monthly subscription fee.
Trade with Higher Accuracy
When you use the 1% Rule to select an ITB in-the-money option strike price, ITB only has to increase 1% for the option to breakeven and start profiting! Remember, if you purchase an at-the-money or out-of-the-money call option and the underlying ETF closes flat at option expiration it will result in a 100% loss for your option trade! In this example, if ITB is flat at 110.50 at option expiration, it will only result in a 3.7% loss for the ITB option compared to a 100% loss for an at-the-money or out-of-the-money call option.
Using the 1% Rule to select an option strike price can result in a higher percentage of winning trades compared to at-the-money or out-of-the-money call options. This higher accuracy can give you the discipline needed to become a successful option trader and can help avoid 100% losses when trading options.
The goal of this example is to demonstrate the powerful profit potential available from trading options compared to ETFs.
The prices and returns represented below were calculated based on the current ETF and option pricing for ITB on 3/20/2024 before commissions.
When you purchase a call option, there is no limit on the profit potential of the call if the underlying ETF continues to move up in price.
For this specific call option, the calculator analysis below reveals if ITB increases 5.0% at option expiration to 116.03 (circled), the call option would make 47.0% before commission.
If ITB increases 10.0% at option expiration to 121.55 (circled), the call option would make 97.7% before commission and outperform the ETF return nearly 10 to 1*.
The leverage provided by call options allows you to maximize potential returns on bullish ETFs.
The Hughes Optioneering Team is here to help you identify profit opportunities just like this one.

Interested in accessing the Optioneering Calculators? Join one of Chuck’s Trading Services for unlimited access! The Optioneering Team has option calculators for six different option strategies that allow you to calculate the profit potential for an option trade before you take the trade.
Short-Term Program from Chuck!
Chuck Hughes has just launched his exciting new trading service program, Lightning Trade Alerts. This new service focuses on low-cost & short-term options trade.
Members will receive hand-picked options trades from the 10-Time Trading Champion, Chuck Hughes.
Call our team at 1-866-661-5664 or 1-310-647-5664 to join or CLICK HERE to schedule a call!
Wishing You the Best in Investing Success,

Chuck Hughes
Editor, Trade of the Day
Have any questions? Email us at dailytrade@chuckstod.com
*Trading incurs risk and some people lose money trading.


Recent Comments