
I’m not sure if you missed this but take a look at an example of a great potential trade I spotted.
Johnson & Johnson (JNJ) is BELOW the 0 on the TSI Indicator. Don’t worry, I’ll walk you through what that means.
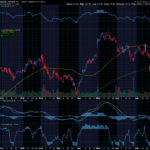
Each candle on the weekly chart represents price movement over a 5-day (week) period. The indicator at the bottom of the chart is a True Strength Indicator (TSI). To learn more about TSI, click here.


If JNJ’s price continues to move DOWN in this example, you could consider a PUT trade. If the price continues to move to $144.00, you could consider a PUT option trade. We are expecting the TSI indicator to continue to head DOWN. JNJ is BEARISH as the signal line moves BELOW the 0. The stock price is $144.62. You would wait until price found a bottom before buying stock.
You could use a PUT option to increase the potential of this trade. Option trading offers the potential of a lower initial investment and higher percentage gain. It is like renting stock versus buying out right.
If you bought one PUT option contract covering 100 shares of JNJ’s stock with a Jan 17th expiration date for the 144 strike, the premium would be approximately $ 1.72 per share, or a total of $172 for the contract of 100 shares. If price FELL $4.00 over the next few weeks, the premium would likely increase approximately $2.00 to $3.72. This is a gain of 116% profit. That would be a nice trade over a short period of time!
Learning more about trading and how to use options is one of the best investments you can make. For more examples like this one and to learn about various indicators that help increase your wins, be sure to visit our site here.
I send you wishes for the very best,
Wendy

Previous Trade:
Two weeks ago, we discussed buying U Calls. It did not reach our target entry price.


Recent Comments