

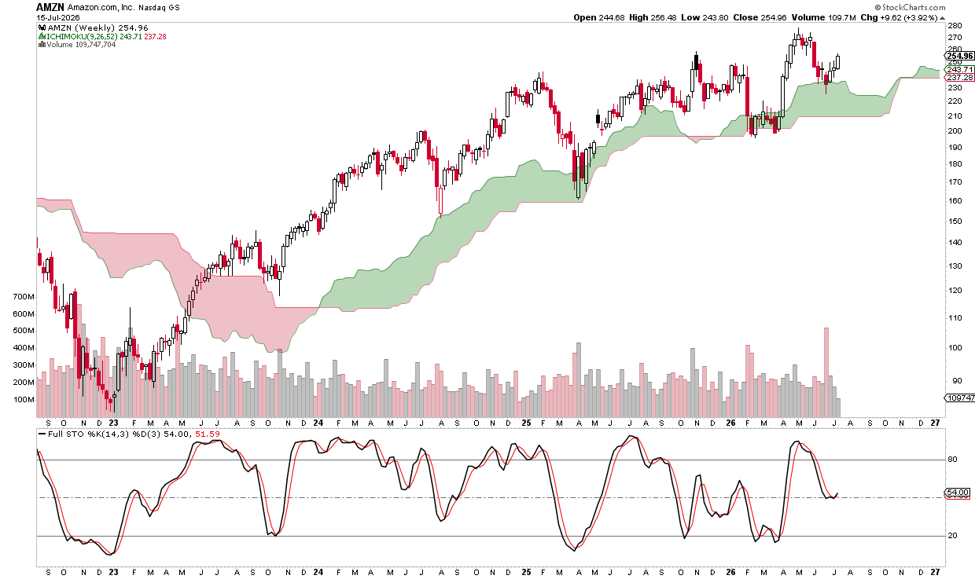
Amazon continues to trade in a long-term uptrend. After pulling back from its recent high near $275, buyers stepped in above the Ichimoku cloud and price has now rebounded back to around $255. The stock remains well above cloud support, which is a positive sign that the primary trend is still intact.
The Ichimoku Cloud is bullish, with price trading above both the cloud and the conversion/base lines. That suggests the recent decline was more of a healthy pullback than a trend reversal.
The Full Stochastic has turned higher from the middle of its range (around 50), indicating momentum is beginning to improve without being overbought. This leaves room for another push higher if buying pressure continues.
Take a look at these indicators on the chart.
One size fits all doesn’t work with price patterns in stocks. Each ticker has it’s favorite pattern that is a clear tell of an upcoming move. Here is the indicator that “decodes” those payout patterns. (details here)
The main level to watch is the recent resistance around $260-$265. A breakout above that zone could lead to another test of the highs near $275. On the downside, initial support sits around $243-$245, followed by the top of the Ichimoku cloud near $235.
Overall, the weekly chart favors the bulls, and the recent consolidation appears constructive. As long as AMZN remains above cloud support, the path of least resistance continues to be higher.
Wishing you the best,
Wendy










Recent Comments