When we spotted the potential for a 181% gain, we had double check. Look at what we found.
I teach everyday people (like me) to trade options. I do my best to write in an understandable way as if we are talking over the kitchen table.
The market was up 3 out of 5 days last week. I am typing this on Wednesday, and you won’t get this until Friday. A lot can change in a couple days.
For today’s Trade of the Day, we will be looking at Applied Materials, Inc. (AMAT).
Let’s look at AMAT’s weekly chart.
The ADX -DI (red line) has crossed the +DI and the black ADX line is up. If the -DI is above the +DI, price should fall. The past several weekly candles are negative. If you want to learn more about ADX, read on or, if not, scroll down to the alert.
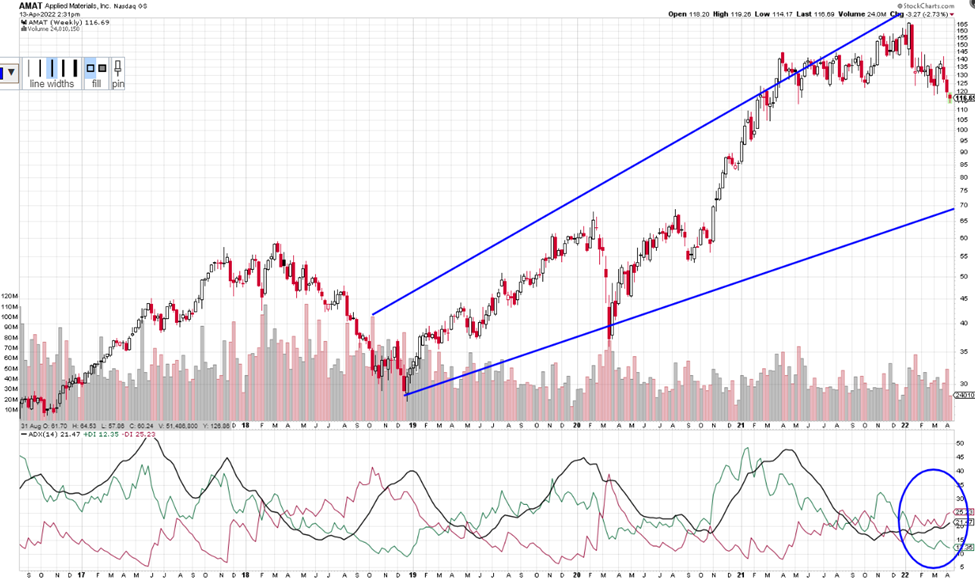
Average Direction Index (ADX) – Strength Indicator
The Average Directional Index consists of 3 lines: Green, Red and Black.
Green = +DI (Bullish)
Red = -DI (Bearish)
Black = ADX Strength Line
The DI line that is on top is in control. If the ADX line is heading up, strength is supporting the DI line that is on top and in control.
Each candle on the chart represents price movement over a 5-day (week) period; therefore, it takes weeks for trades to play out. When the -DI crosses over the +DI line, it gives a buy signal for Puts as the -DI line (red) appears as if it is in control and rising to head up on the ADX indicator, and as the ADX turns up that is even more bearish, suggesting a downward move is gaining strength. When the +DI (green line) crosses the red and the black line points up it shows an upward trend and Calls can be considered.
AMAT’s Potential Trade – Showing Strength
This signal could give a quick payout if it continues its downward move, and the strength of this pattern continues. I am typing this on Wednesday and AMAT costs about $117. If AMAT’s price moves below $115 and the – DI (red line) is above the +DI with the black line heading up, you could consider a Put trade. The short-term price target for AMAT is $105. With the swings in past months, I am suggesting small profit targets until a market trend starts again.
Option trading offers the potential of a lower initial investment and higher percentage gain. Let’s look and make a comparison.
If you bought 1 share of AMAT it would cost about $117. You would not buy shares if you were expecting the price to go down. You would wait until it found a bottom then buy.
If you bought 1 Put option covering 100 shares of AMAT with a May 20th expiration date for the 105 strike the premium would be approximately $2.77 today or $277 for 1 option. If price fell to $105 over the next few weeks, the premium would likely increase $5.00 giving $500 profit on your $277 investment, this is a 181% gain.
Trading options is a win, win, win opportunity. Options often offer a smaller overall investment, covering more shares of stock and potential for greater profits.
I like to stress when trading options, you don’t need to wait for the expiration date to close the trade. You can close anywhere along the way prior to the expiration date. It is never a bad idea to take profit.
Trading options is like renting stocks for a fixed period. The potential to generate steady income with options is real and it can be transforming. Watch this video to learn how you can use option trading to achieve financial freedom. click here
Yours for a prosperous future,
Wendy Kirkland

Past Equity Candidates:
Last week we discussed buying TWTR calls. It didn’t reach the target entry so there would have been no trade.
Two weeks ago, we talked about buying LULU April 29th 400 strike calls. On 4/4 price rose to the target entry and the premium was $7.90. On 4/13 you could have sold at $11.40 or a 44% profit.


Recent Comments