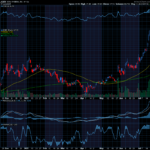
Welcome back to Trader’s War Room! Today, we’re uncovering a hidden gem in the world of technical analysis—Market Decision-Making (MDM) Graphs. This advanced tool can help you detect key market shifts before they happen, giving you a unique edge in spotting trends, breakouts, and reversals. Our top trader, Andy Chambers, consistently uses MDM Graphs to identify critical decision points and maximize his profits. Click here to learn about Andy’s Market Propulsion Strategy! Ready to unlock the power of MDM Graphs? Let’s dive in!
What are MDM Graphs?
MDM Graphs track where key market decisions are being made, offering a bird’s-eye view of potential price action at pivotal levels. They measure price movement, volume, and trend behavior, giving traders a deeper insight into market sentiment and psychology. These graphs visually mark areas where market participants—buyers and sellers—are most likely to change their behavior, helping you spot upcoming breakouts, reversals, or consolidations.
The beauty of MDM Graphs lies in their ability to simplify the market’s complexity. By pinpointing where decisions are likely happening, traders can make more confident calls on when to enter or exit trades.
Not sure which stocks to focus on? Discover Joe Duffy’s Insider Secret for growing a small trading account—one of the best strategies out there! Check it out now and get ahead of the curve.
How to Read MDM Graphs: Get Ahead of the Curve
MDM Graphs reveal decision zones, which are crucial to understanding market behavior. Here’s how to decode them:
- Decision Clusters: Price consolidates around a specific level, signaling indecision between buyers and sellers. Watch closely—breakouts often follow these clusters.
- Volume Confirmation: A spike in volume at a decision point means there’s high market conviction, strengthening the signal.
- Trend Continuation or Reversal: If price reaches a decision zone and fails to break through, this often signals a trend reversal. Alternatively, breaking through a zone on strong volume confirms trend continuation.
MDM Graphs excel at visualizing these dynamics. Want more tips on using MDM Graphs in your trading strategy? Click here for expert analysis and strategies from Tradewins Daily!
MDM Graphs in Action: Trading Strategies for Success
Let’s look at how you can integrate MDM Graphs into your trading approach:
- Breakout Trading: When the price breaks through a key decision zone on an MDM Graph, especially with increased volume, it’s often a sign of a strong continuation. Combine this with indicators like Moving Averages or MACD for higher confidence.
- Reversal Identification: Failed attempts to break through a decision point suggest a trend reversal is imminent. Use these signals to exit positions or switch strategies.
- Sideways Market Trading: During periods of consolidation, MDM Graphs help traders anticipate the next major move by identifying clusters. Stay ahead by entering at the earliest sign of momentum change!
Ready to learn how other traders are applying MDM Graphs in their strategies? Expert trader Ian Cooper uses advanced trading tools to spot market trends and identify key entry and exit points. Elevate your strategy with his insights—click here to unlock Ian Cooper’s Q-Factor pattern!
Avoiding MDM Graph Pitfalls
MDM Graphs are invaluable, but they work best when paired with additional confirmation tools. One pitfall traders face is relying too heavily on a single decision zone without considering broader market trends. Combine MDM insights with indicators like the Relative Strength Index (RSI) or Stochastic Oscillator to confirm signals and reduce false positives.
Volume confirmation is another must. Ensure that when price moves through a decision zone, volume supports the action, reinforcing the signal’s reliability.
The Bottom Line: Gain an Edge with MDM Graphs
MDM Graphs offer a unique way to visualize market psychology, helping traders anticipate shifts in momentum and identify hidden opportunities. By integrating MDM Graphs into your trading strategy, you’ll gain deeper insight into market decision-making, improve your timing, and sharpen your trading decisions.
Thanks for exploring MDM Graphs with us today! Stay tuned to Trader’s War Room for more expert strategies. Don’t forget to check out Tradewins Daily for exclusive tools and techniques that can elevate your trading game to new heights.
Happy Trading!


Recent Comments