Wednesday, September 8th, 2021
Happy Wonderful Wednesday!
I have put together a few articles about key indicators that I use often and are extremely helpful when you are identifying the symbols that are setting up for a big move. These indicators can also be very helpful when tryin to identify a price target to use when building an option trade.
Today, I’d like to dive deeper into the ADX or Average Directional Index. I feel like this is very important in the current market as we have been following a strong trend for quite a while and we want to make sure we keep a close eye on the indicators that will give us a heads up when things are about to change.
ADX is often used to get an indication of how much power a trend has in the direction it is heading. Likewise, the ADX can give us an idea of when the trend is weakening and could potentially reverse.
Average Directional Index (ADX) Points to Direction and Strength
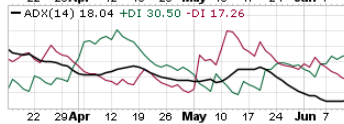
ADX is an easy indicator to interpret. The +DI line (green) is bullish and when it is on top, it suggests price is going to head up. When the -DI line (red) is on top, it suggests price is going to drop.
The black line is the strength line and when it heads up, it is telling you strength is moving into the DI line that is on top and in control. When the ADX line has been heading down, the DI line on top has been weakening and is ready for a change.
When the DI lines swap places and cross up and the ADX heads up, it suggests strength is moving into the new DI direction.

ADX signal = Profit Payout
Each candle on the chart represents price movement of a week. As the + DI heads up and moves above the black line and both remain above the red line, it suggests there is bullish strength that could continue to grow, especially once the black line starts to turn up. If price continues to move up, the ADX line (black) will continue to turn to head up to imply that strength will continue to support the trade. As long as the ADX is heading up, it means it is supporting the bullish- up direction. The opposite is true if the -DI line heads up to cross the green +DI line – this suggests bearish strength and a drop in price. If the ADX line heads up while the red -DI is on top, is it saying strength is building into the downward direction.
Here is a chart of the QQQ to see an example of the ADX indicator.
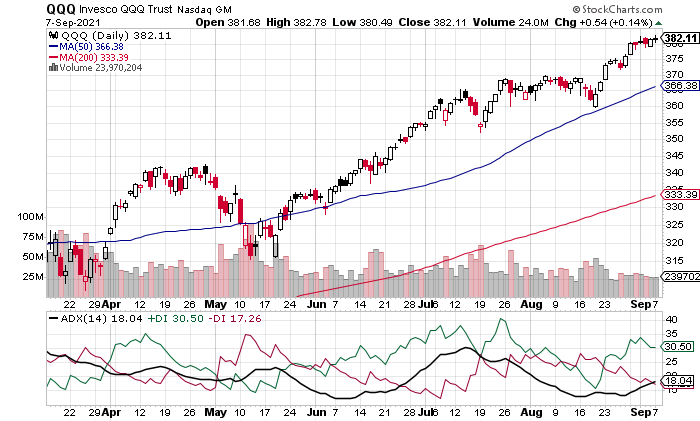
We can see on the chart that the +DI moved above the -DI right around Aug 23. The upward trend had started a few day prior but the ADX didn’t confirm the strength until then. Since then we have seen the QQQ continue to climb.
When the ADX line is above 25, the trend is considered strong, below the 25 it is considered weaker. We can see that recently the ADX line has started to turn up indicating that its strength is increasing. As the ADX rises it shows that trades using the trend will have a high probability of success.
This indicator can be used on any chart to help you find trades that will increase your likelihood of success. If you are interested in learning more ways to apply the ADX, you should consider getting Inevitable Trend Moves. This program will show you how increase your odds of success on every trade.
If you are having any kind of trouble taking advantage of these trades, I don’t want you to miss out. I have put together programs that help traders just like you access the potential profits that options provide. I write like we are having a conversation, so the information is easy to understand and apply. Be sure to check out the programs shared in this email and we will make it easy for you to get your share.
I love to trade, and I love to teach. It is my thing.
Yours for a Prosperous Future,
Wendy Kirkland
PS-I have created this daily letter to help you see the great potential you can realize by trading options. Being able to recognize these set ups are a key first step in generating wealth with options. Once you are in a trade, there is a huge range of tools that can be used to manage the many possibilities that can present themselves. If you are interested in learning how to apply these tools and increase the potential of each trade, click here to learn more.


Recent Comments