
Dear Reader,
Yesterday, we looked at a Daily Price Chart for Hyatt Hotels Corp., noting that the stock has been making a series of new 52-Week Highs recently.
For today’s Trade of the Day we will be looking at a Daily Price chart for CDW Corp. stock symbol: CDW.
Before breaking down CDW’s daily price chart let’s first review which products and services are offered by the company.
CDW Corporation provides information technology (IT) solutions in the United States, the United Kingdom, and Canada. It operates through three segments: Corporate, Small Business, and Public. The company offers discrete hardware and software products and services, as well as integrated IT solutions, including on-premise, hybrid, and cloud capabilities across data center and networking, digital workspace, and security.
Now, let’s begin to break down the Daily Price chart for CDW. Below is a Daily Price Chart with the price line displayed by an OHLC bar.

Buy CDW Stock
The Daily Price chart above shows that CDW stock began reaching a series of higher highs and higher lows since mid-January.
This pattern of bullish trading suggests the stock will march on to a further advance.
You see, after a stock makes a series of two or more higher highs and higher lows, the stock typically continues its price up trend and should be purchased.
Our initial price target for CDW stock is 220.00 per share.

106.9% Profit Potential for CDW Option
Now, since CDW stock is currently making a series of higher highs and higher lows this means the stock’s bullish rally will likely continue. Let’s use the Hughes Optioneering calculator to look at the potential returns for a CDW call option purchase.
The Call Option Calculator will calculate the profit/loss potential for a call option trade based on the price change of the underlying stock/ETF at option expiration in this example from a flat CDW price to a 12.5% increase.
The Optioneering Team uses the 1% Rule to select an option strike price with a higher percentage of winning trades. In the following CDW option example, we used the 1% Rule to select the CDW option strike price but out of fairness to our paid option service subscribers we don’t list the strike price used in the profit/loss calculation.
Trade with Higher Accuracy
When you use the 1% Rule to select a CDW in-the-money option strike price, CDW stock only has to increase 1% for the option to breakeven and start profiting! Remember, if you purchase an at-the-money or out-of-the-money call option and the underlying stock closes flat at option expiration it will result in a 100% loss for your option trade! In this example, if CDW stock is flat at 213.01 at option expiration, it will only result in a 5.2% loss for the CDW option compared to a 100% loss for an at-the-money or out-of-the-money call option.
Using the 1% Rule to select an option strike price can result in a higher percentage of winning trades compared to at-the-money or out-of-the-money call options. This higher accuracy can give you the discipline needed to become a successful option trader and can help avoid 100% losses when trading options.
The goal of this example is to demonstrate the powerful profit potential available from trading options compared to stocks.
The prices and returns represented below were calculated based on the current stock and option pricing for CDW on 2/17/2023 before commissions.
When you purchase a call option, there is no limit on the profit potential of the call if the underlying stock continues to move up in price.
For this specific call option, the calculator analysis below reveals if CDW stock increases 5.0% at option expiration to 223.66 (circled), the call option would make 50.8% before commission.
If CDW stock increases 10.0% at option expiration to 234.31 (circled), the call option would make 106.9% before commission and outperform the stock return more than 10 to 1*.
The leverage provided by call options allows you to maximize potential returns on bullish stocks.
The Hughes Optioneering Team is here to help you identify profit opportunities just like this one.

Interested in accessing the Optioneering Calculators? Join one of Chuck’s Trading Services for unlimited access! The Optioneering Team has option calculators for six different option strategies that allow you to calculate the profit potential for an option trade before you take the trade.
Average Portfolio Return of 191.0%
Below is a screenshot of the current open trade profit opportunities from Chuck’s Inner Circle Trading Service. There are currently $167,335.13 in open trade profit opportunities with an average portfolio return of 191.0% demonstrating the ability of the Optioneering Strategy to deliver substantial returns with no losing portfolios**.
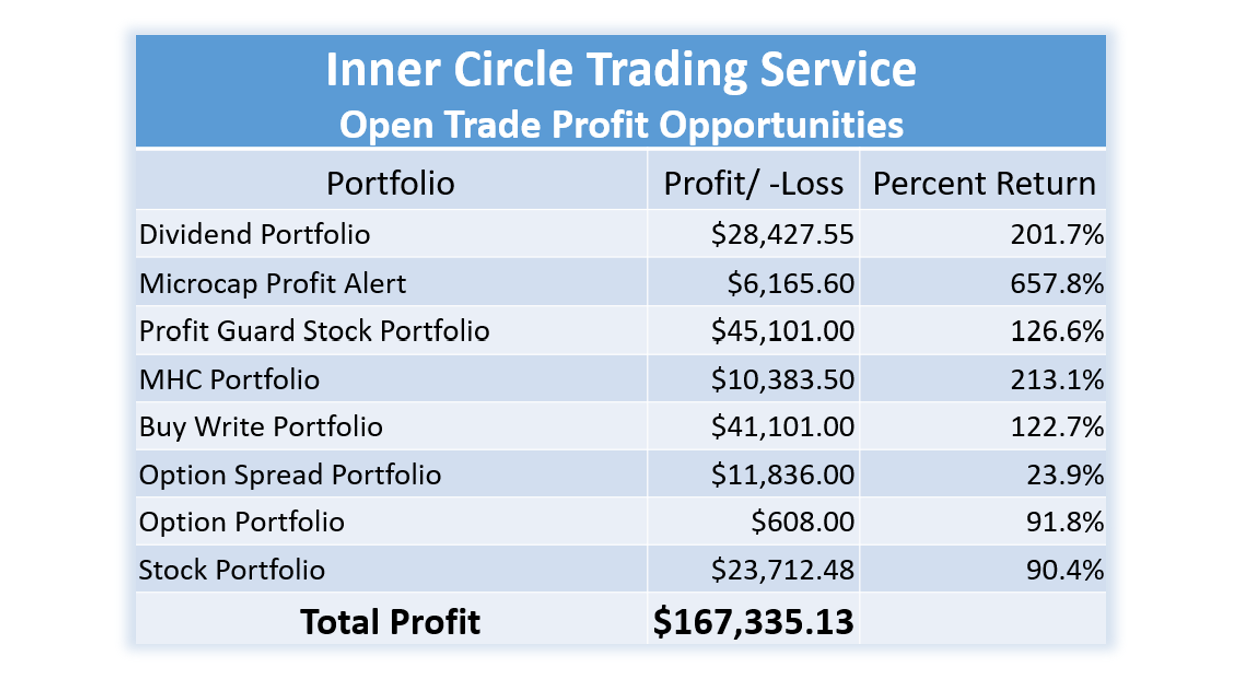
**Open trade profit results represent the open trade profit performance for the portfolio displayed on 2/17/23. Open trade profits may have increased or decreased when trades were closed out. Trading incurs risk and some people lose money trading. Past performance does not necessarily predict future results. Member profits and losses are not tracked. Profit potential is taken from results of signaled trades, not actual member results. Not all members make the trades.
Get Trade Insights Directly From Chuck
You can start getting market insights directly from 10-Time Trading Champion Chuck Hughes.
See what he’s trading and when with his exclusive Inner Circle Trading Service where he will send you his hand-picked stock and option trades.
Just call Brad at 1-866-661-5664 or 1-310-647-5664 to join or CLICK HERE to schedule a call!
Wishing You the Best in Investing Success,

Chuck Hughes
Editor, Trade of the Day
Have any questions? Email us at dailytrade@chuckstod.com
*Trading incurs risk and some people lose money trading.


Recent Comments