
This last week has been all about a signal that has been pretty damn accurate. Now we are seeing it in an powerful metric of the broader market. Let’s look at what that means and a potential trade it creates.
The signal is the MACD Crossover. We have been looking a bullish examples but it works just as well for bearish reversals. Here is yesterday’s article that showed one of the caveats of this signal that is important to know. Let’s look at a chart of the S&P that is a great way to see which direction the prevailing winds are blowing.
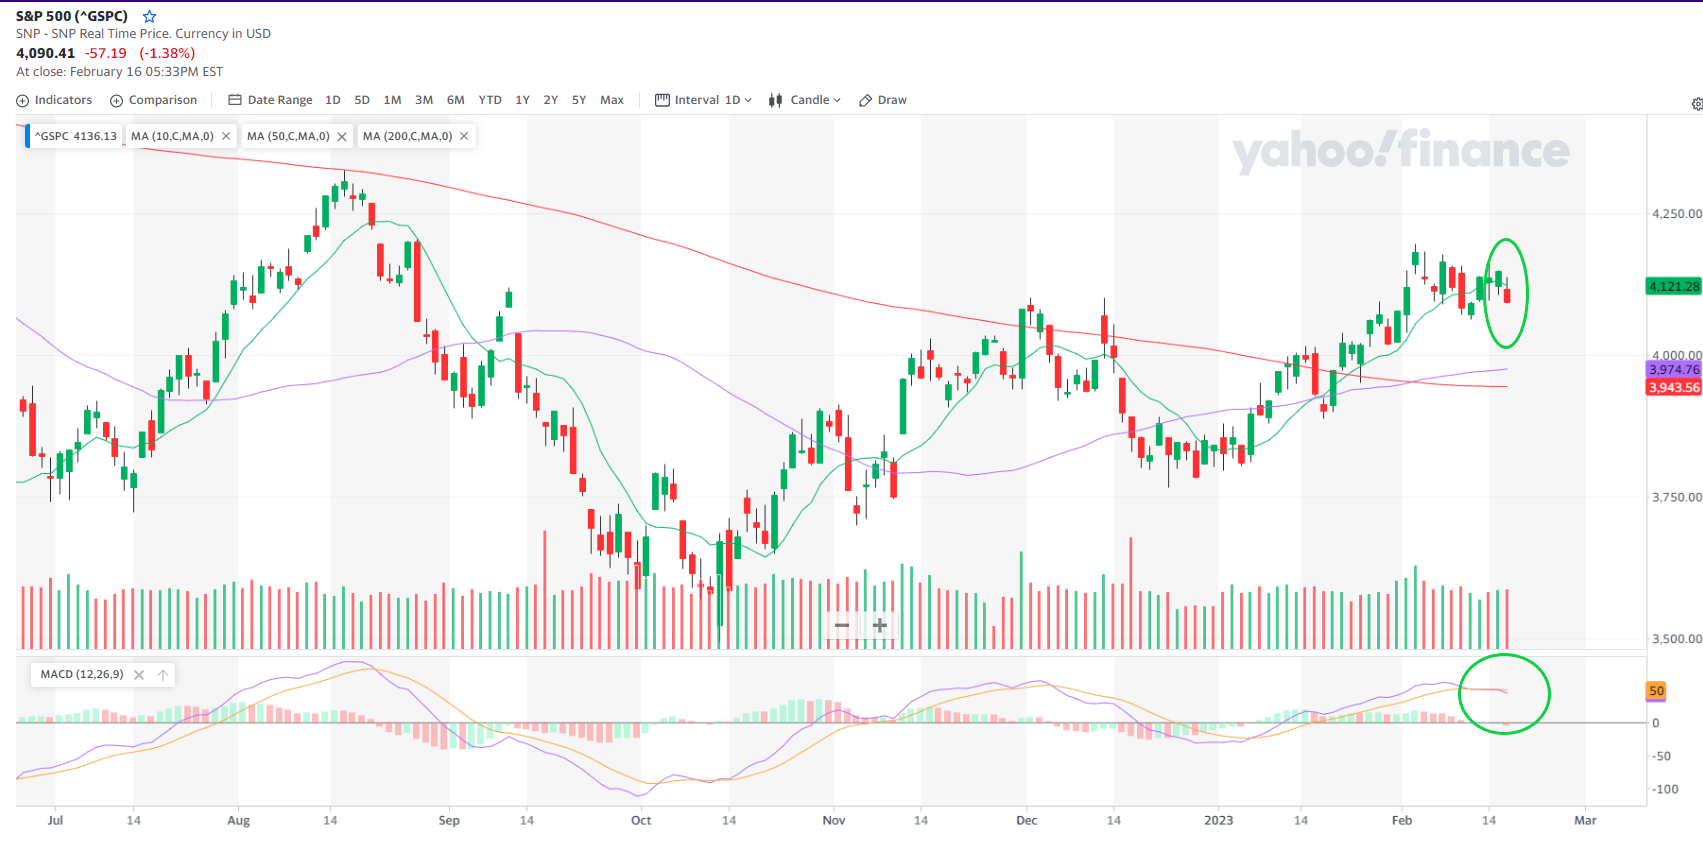

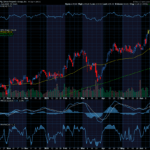
You can see on the chart that the MACD (the green circle at the bottom of the chart is crossing over to the down side in a bearish move. If you look back at the previous times it has done this it has been a pretty consistent sign of a top. We can also see an early confirmation of this in that the S&P closed below its 10 day moving average.
When you can confirm the direction of the broader market and it is acting consistently it increases the odds of individual stocks or assets moving in the same direction. There will definitely be exceptions, but most will follow the broader trend. When we get a clear signal to the down side for the S&P we can use some of the bear trading tools to take advantage of this set up.
One way to used them is to look at a call option on an inverted ETF like SPXU. The March 17th 18 calls are very cheap at just .10.
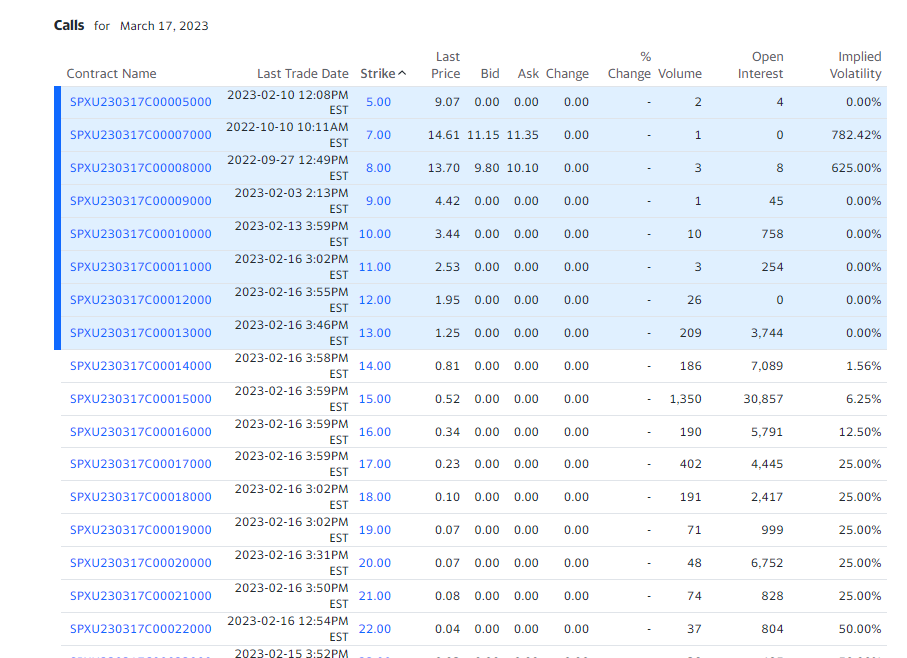
Keeping our risk limited to a .10 premium is what makes the inverted ETF an attractive option. Definitely an opportunity to watch.
Keep learning and trade wisely,
John Boyer
Editor
Market Wealth Daily


Recent Comments